Posts

Lead Firm Strategy Implementation – Indonesian Blue Swimming Crab

Overview

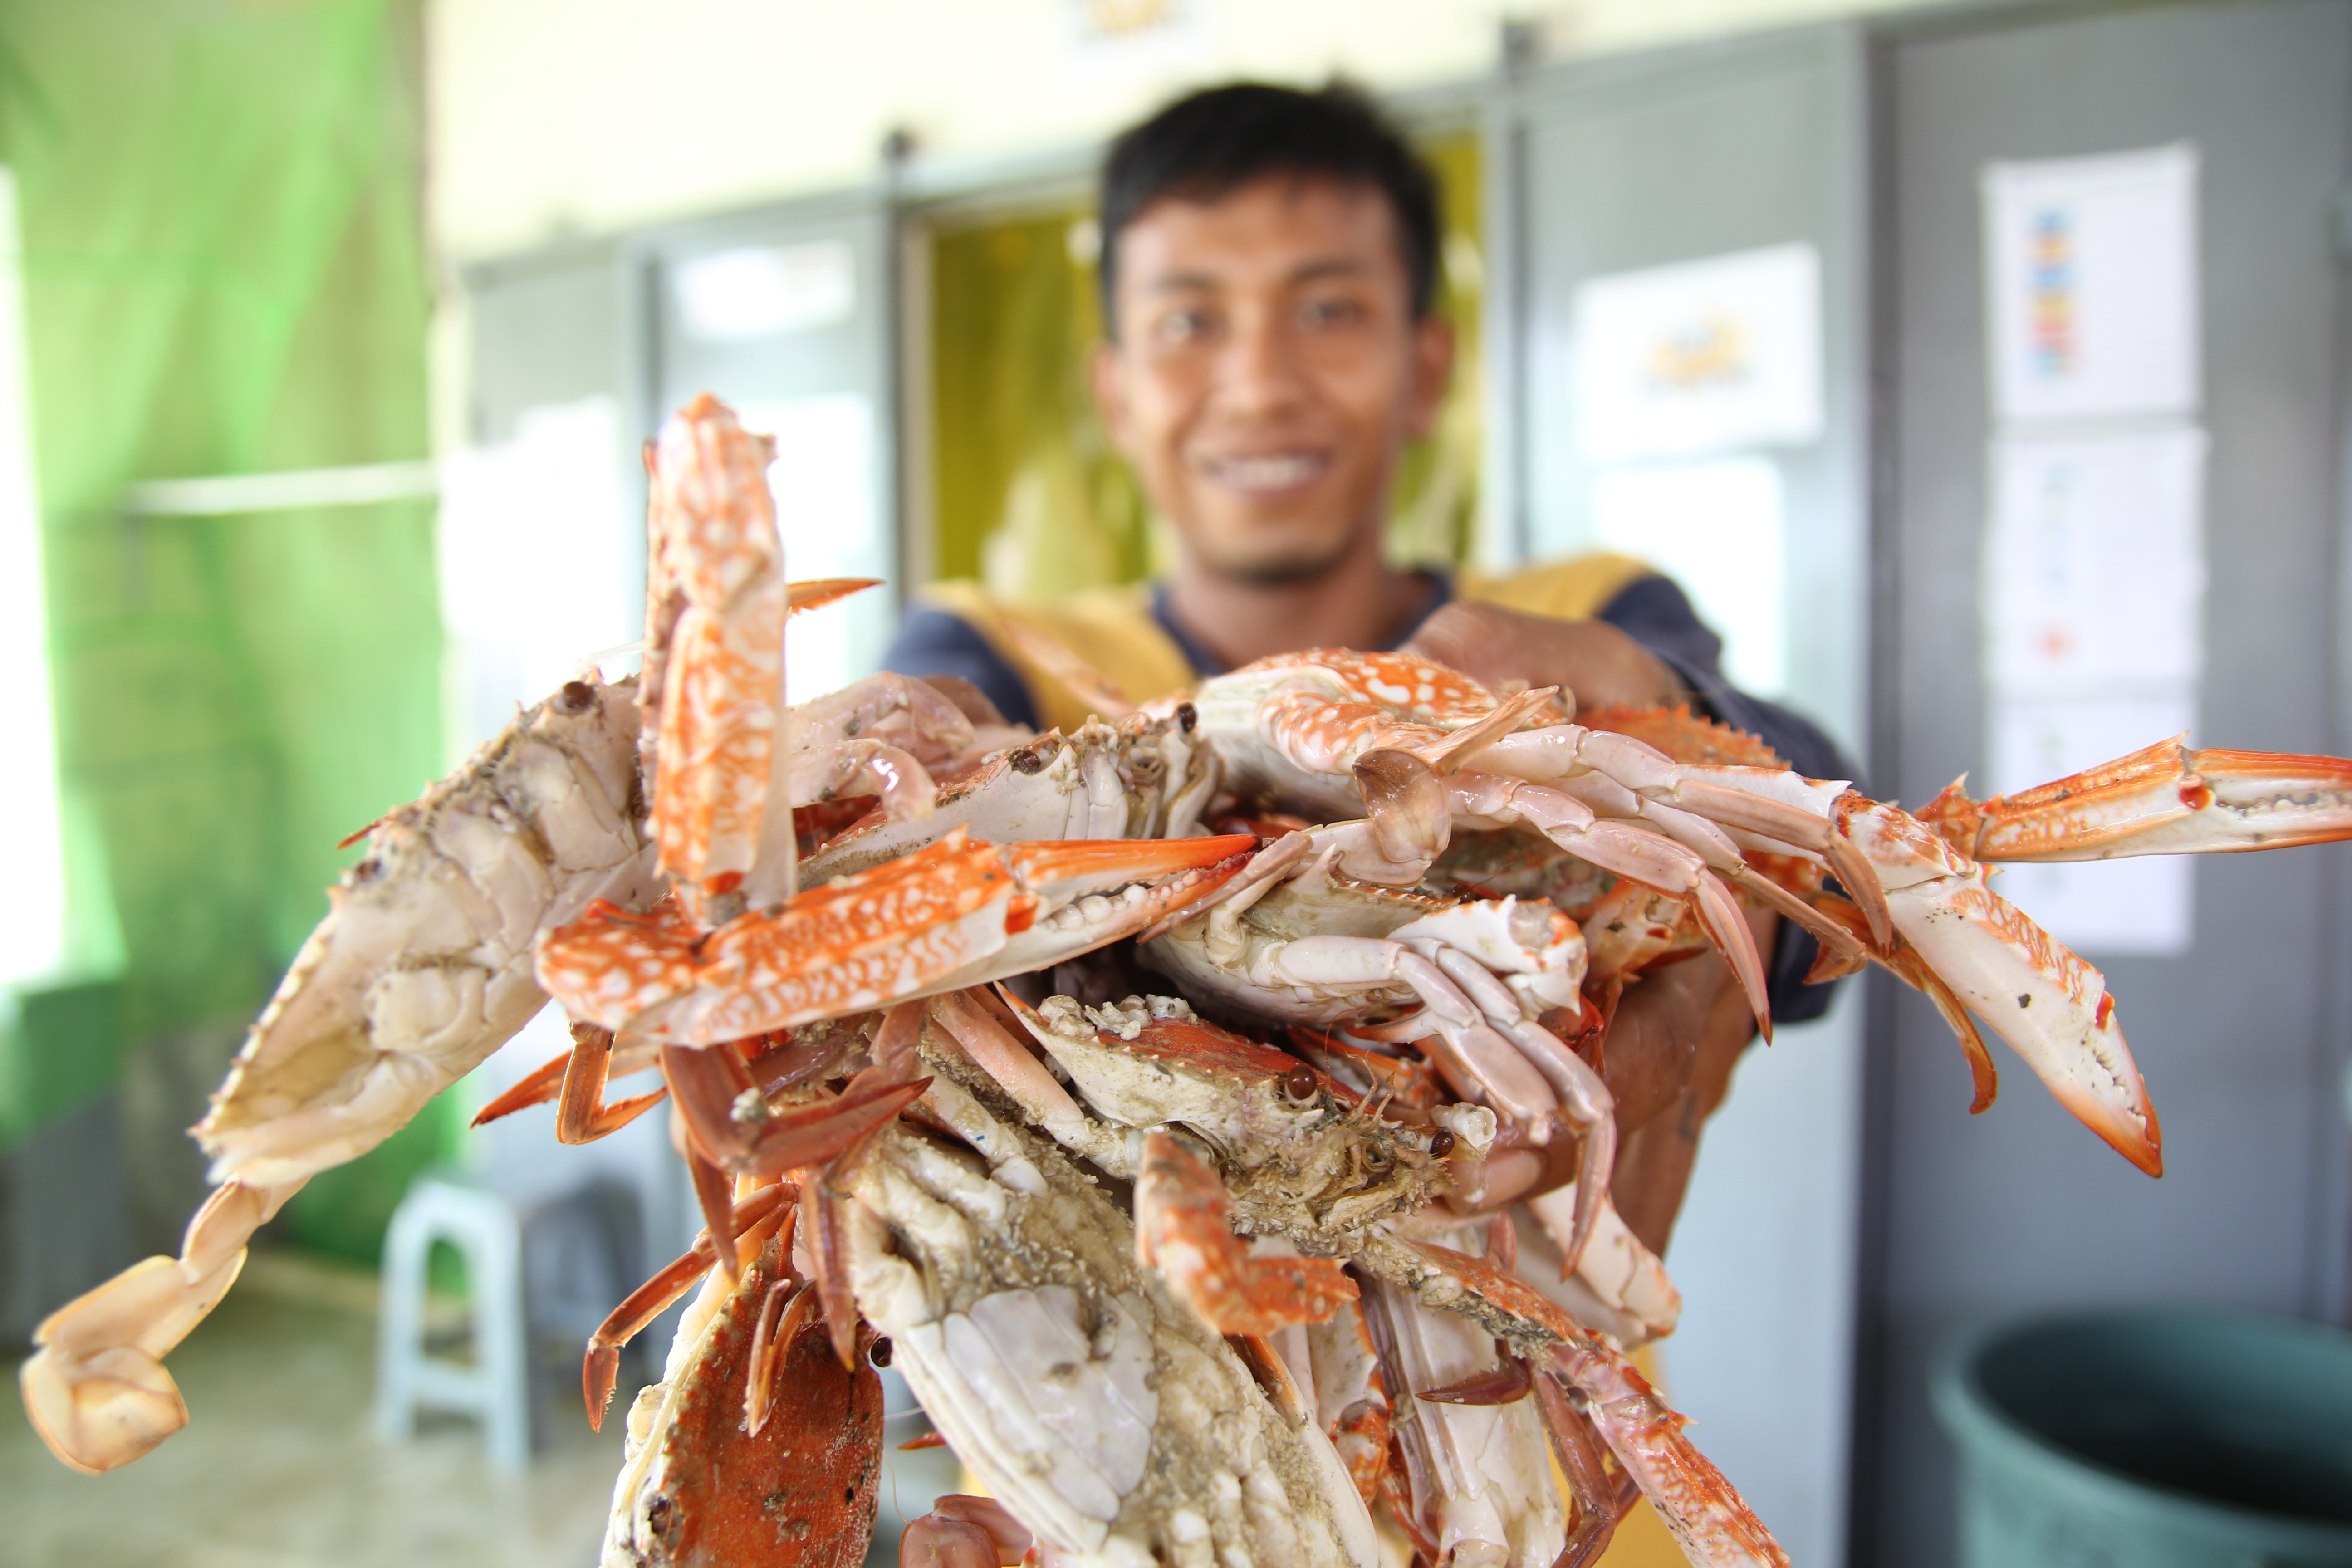
In 2015, Wilderness Markets completed a value chain summary of the blue swimming crab (BSC) fishery in Indonesia in which we analyzed the current state of fishery data systems, resource management, infrastructure, and enterprise capacity. Based on these findings, we recommend a lead firm strategy to move the fishery toward sustainability. Like many fisheries in emerging markets, the Indonesian BSC fishery lacks reliable data and, despite new national policies, functions largely without effective management. The value chain has strong, established commercial and social relationships, indicative of the power and influence of a small group of 16 processors buying from 400 mini-plants that, in turn, purchase crab from more than 65,000 fishermen.

In this case, the lead firm is a U.S. based company, Blue Star Foods. Blue Star is working to create financial and social incentives to enable fishermen to transition faster to sustainable fishing practices. Through its purchasing power and relationships, Blue Star is therefore in strong position to influence the practices of a range of processors, who have commercial relationships with a network of mini-plants, collectors, and fishermen.

BSC traps

Sumatran vessel with collapsible traps

Lead Firm Pilot Design

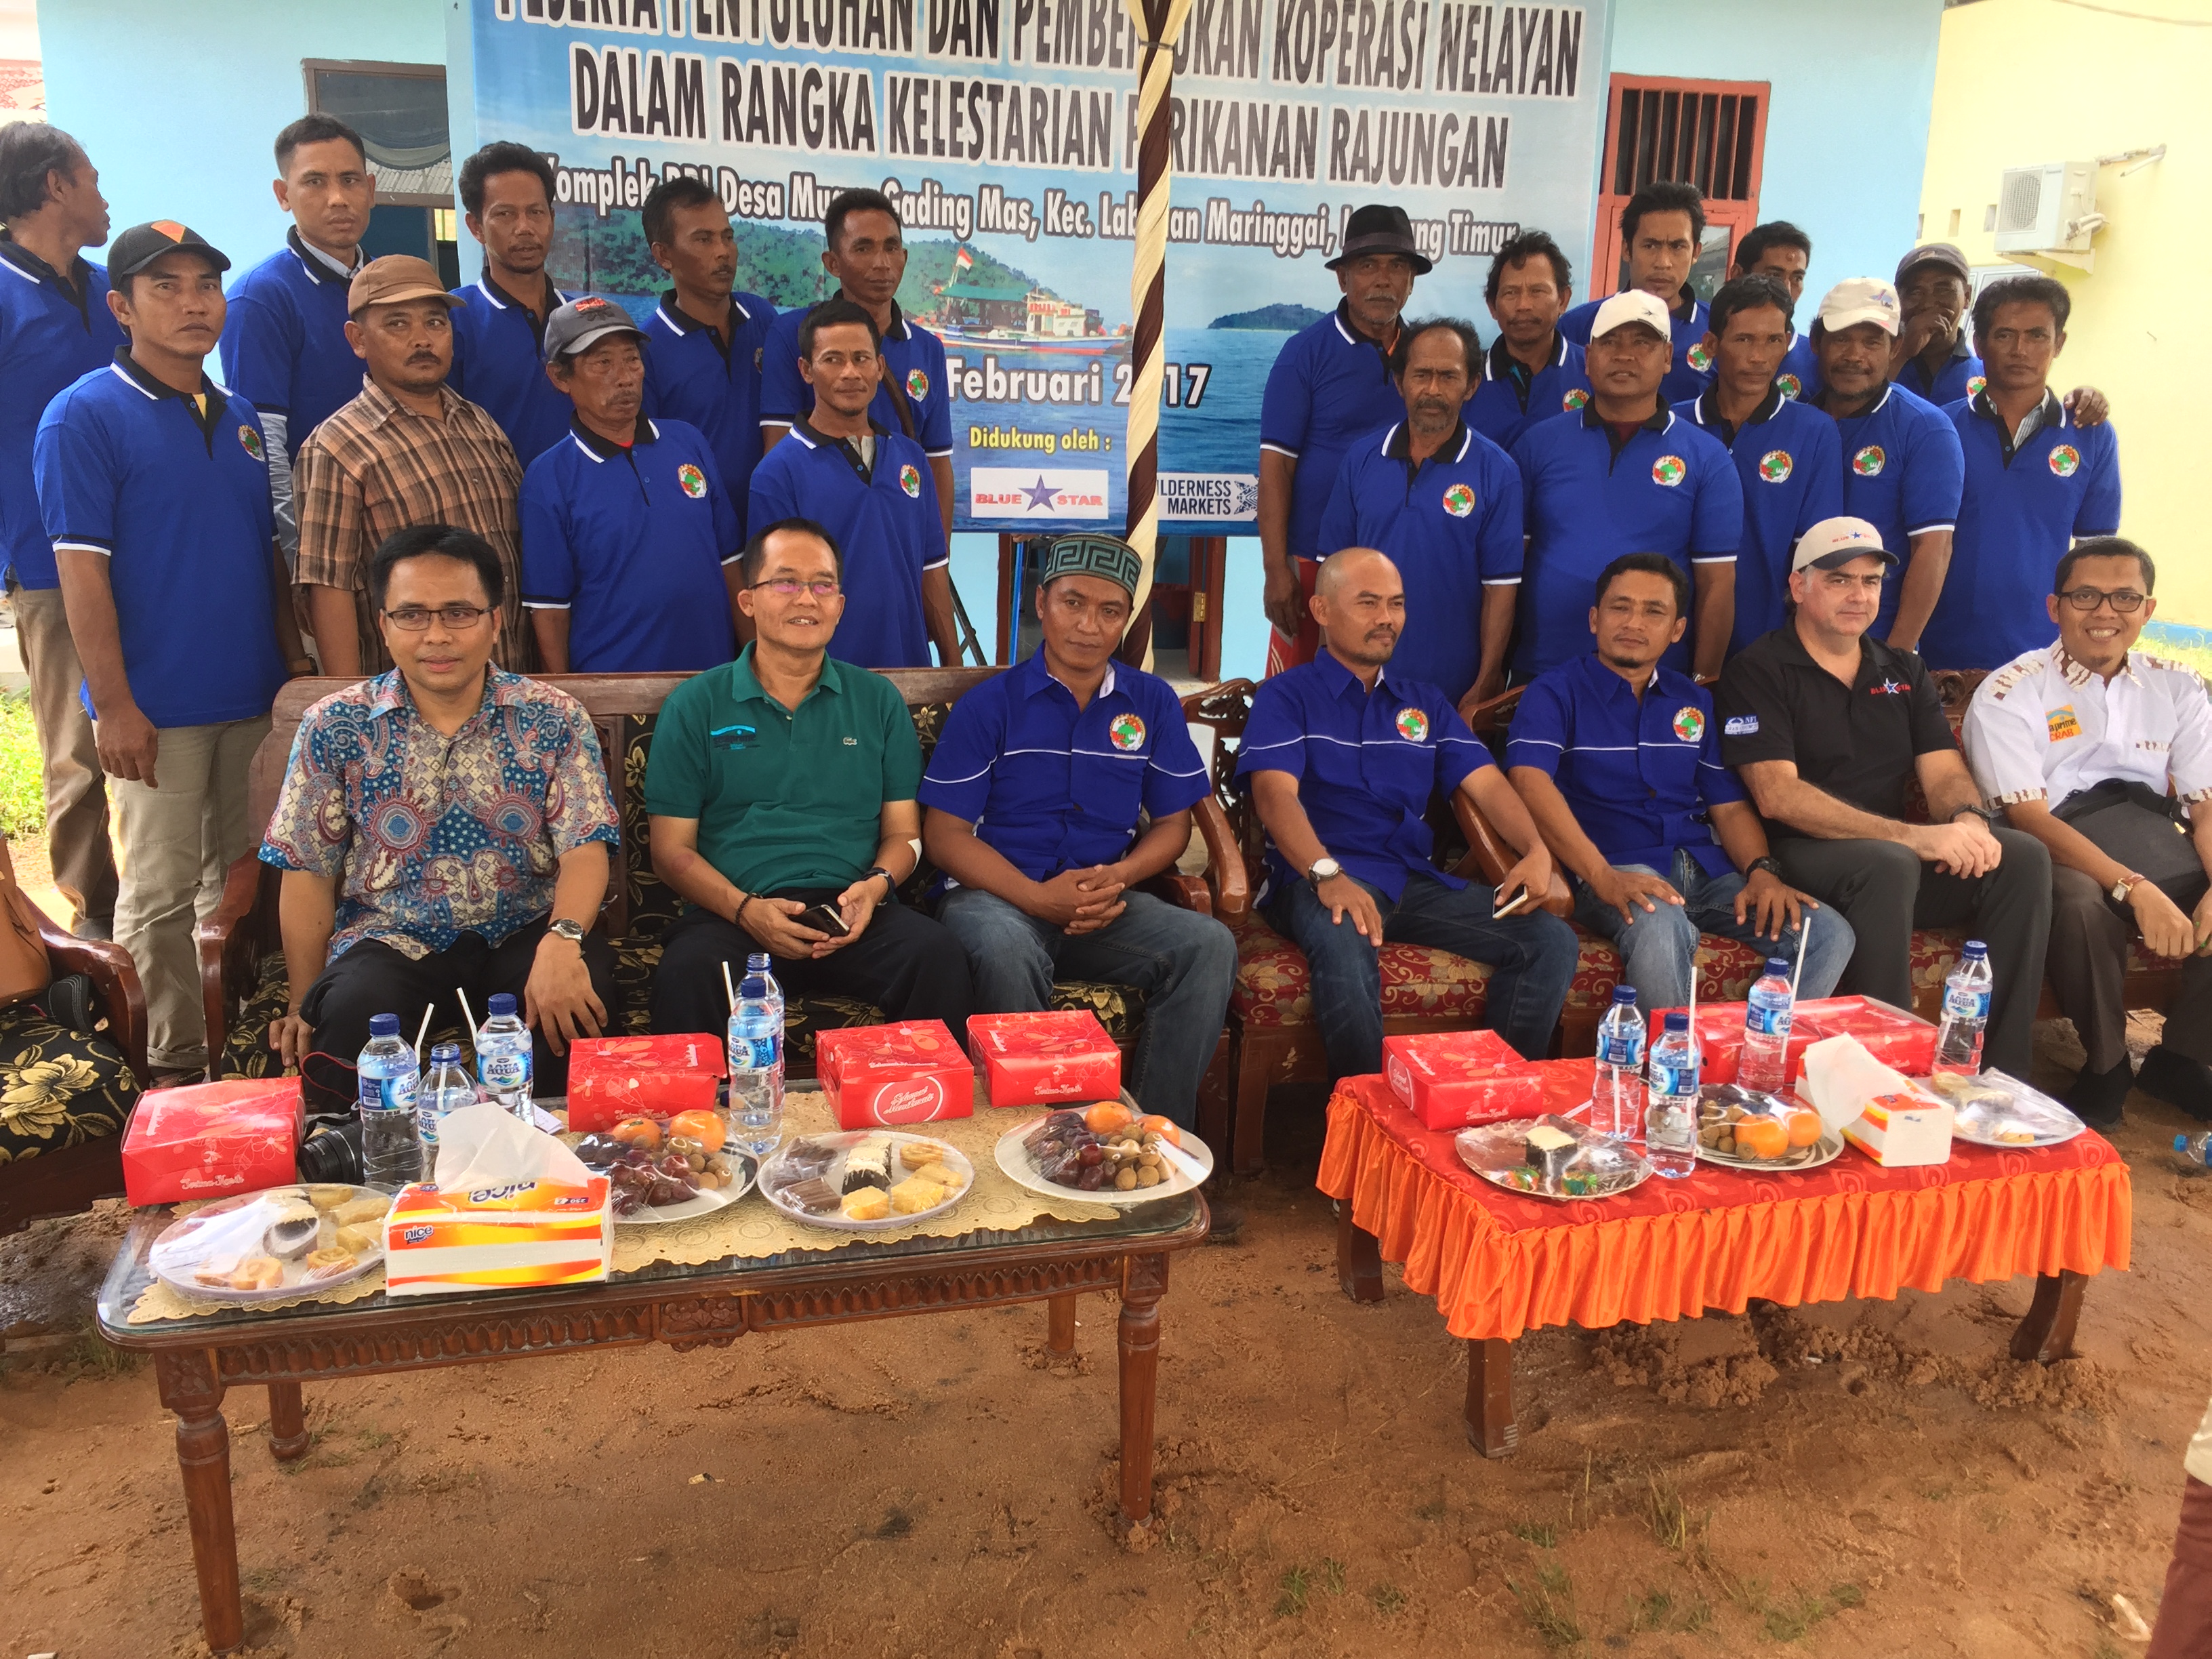
With Blue Star and local harvesters, we are developing an investment model based on a pilot partnership between the lead firm and a fishing cooperative (in development). The model brings together philanthropic and private capital and provides financial, social, and environmental returns. It includes:

  • Purchase commitments based on price, quality and standards
  • Investments in fishermen cooperatives to motivate gear improvements
  • Improved fishery data collection and traceability
  • Support for harvest control compliance

This pilot is designed to attract private, return-seeking impact investment and complement ongoing work by NGOs to improve fishery management. We expect this approach will enable local fishermen to adopt sustainable practices faster than waiting for the government to independently create and enforce management changes, and without the economic hardship for fishermen that often accompanies changes in fishery regulations. It will also bolster business advocacy for more effective fisheries management policies and enforcement through a local cooperative structure.

lead firm crab

BSC fisherman with new vessel tracking device

Goals and expected outcomes

Ultimately, as a result of better data collection and effective management, the fishery will produce higher yields of BSC. It will also provide a traceable, sustainably harvested product with a competitive advantage in key U.S. and E.U. markets. This will then allow Blue Star and supporting investors to recoup their investments in sustainable practices.

By embedding this lead firm work within existing value chain relationships and practices, we aim to:

  • Demonstrate the financial viability of investments in fishery data collection and management, thus attracting additional private investment in these practices.
  • Create new norms that are sustained because of their business value and not ongoing philanthropic support or government subsidies.
  • Provide clear and reliable financial benefits for small-scale fishermen to make gear changes; follow harvest control measures; and take on other sustainable fishing practices. Immediate economic well-being is thereby aligned with sustainable practices to improve compliance and reduce the localized short-term, negative impacts of fishery restrictions.
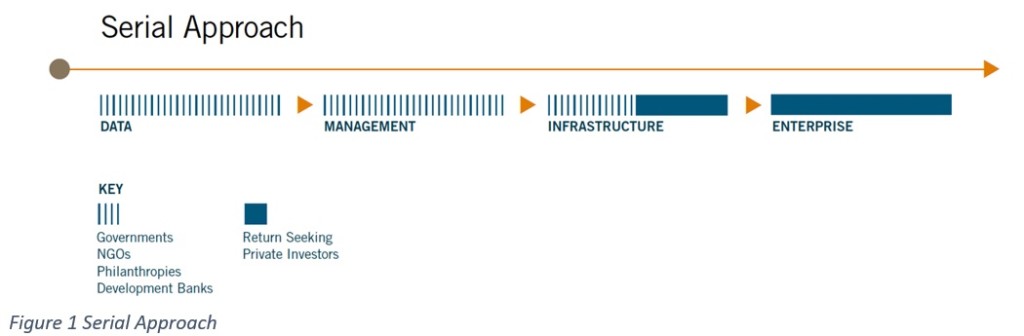
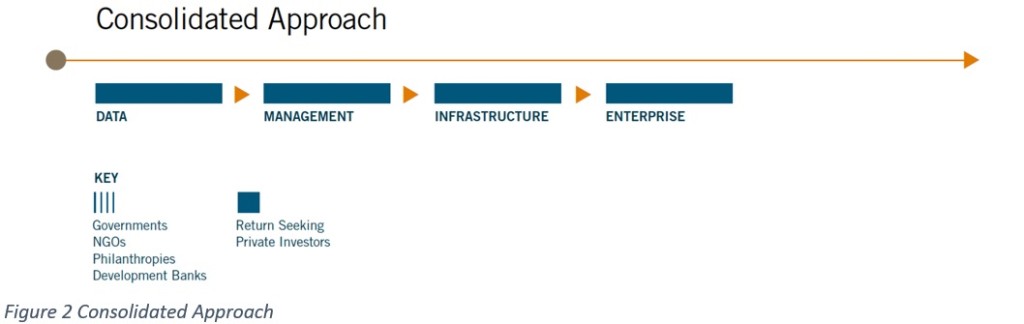
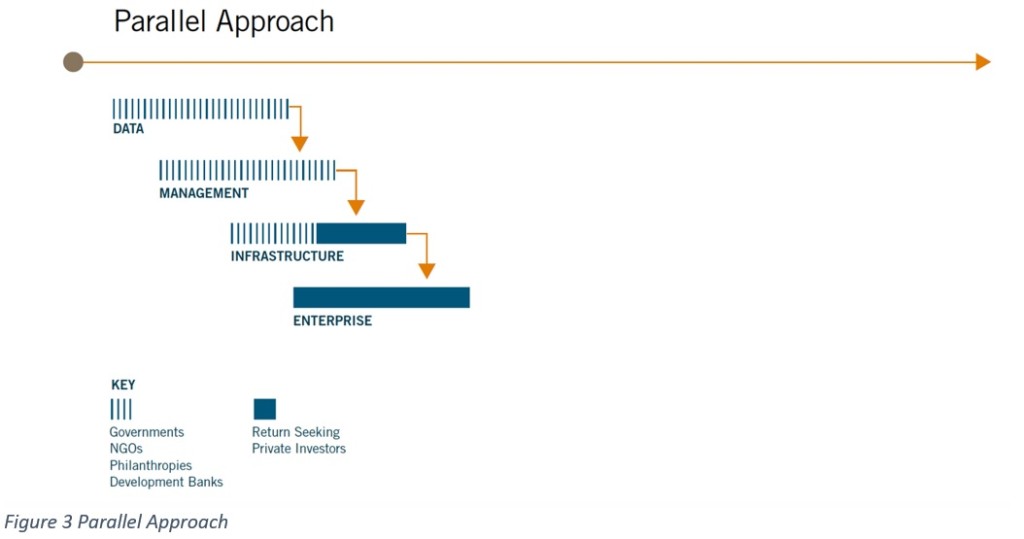
  • Finally, test a new, “parallel” investment model for combining philanthropic, government, and private sector funding to address fishery management. If successful, other emerging market fisheries can tailor the model.

We are currently seeking additional partners to join us in this lead firm pilot project. Please get in touch with us if you would like more information and/or would like to get involved.

Fishing cooperatives in Indonesia?

Why we are helping to setting up a harvester cooperative in Indonesia’s blue swimming crab fishery

Wilderness Markets, in collaboration with Blue Star Foods (USA), PT Blue Star Nusantara through one of its subsidiaries PT Siger Jaya Abadi, recently teamed up to assist in the formation of a harvester cooperative in Indonesia. We were recently honored to participate in the launch of the cooperative in Maringgai.

Based on our experience in coffee, cocoa, tea, cashew, macadamia and honey value chains, we have plenty of experience on the advantages and disadvantages of working with producer organizations (POs), usually cooperatives (1). They often fail, riven by poor management, member disagreement and poor financials. Indeed, Dalberg (2) attributes some of the main reasons for lack of smallholder participation to one or more of the following reasons:

  • POs provide poor services because of low internal capacity
  • Insufficient access to resources like financing and technical assistance
  • Exclusion of smallholders and women from POs
  • Weak governance and leadership of the PO
  • State intervention in POs for political gain

So why did we decide to support this initiative?

  1. Improve harvester representation in the fishery: Many of the harvesters in this fishery are unregistered individuals, with limited access to services and no mechanism for representation
  2. Secure access to technical assistance for harvesters for best fishing practices
  3. Create access to financing for harvesters to support their transition to more sustainable fishing methods to decrease pressure on the fishery
  4. Improve economies of scale: Developing an aggregation mechanism like a PO to permit harvester participation in a global value chain on key issues such as price, quantity and standards.

1. Improve Harvester Representation

Field research in the fishery indicated low levels of harvester registration via the national fisher identification card (Kartu Nelayan). Therefore, these individuals are unable to access a range of government services.

At the same time, the Government of Indonesia has established benefits for cooperative structures to effectively serve its population; however, by not having a cooperative structure in place the harvesters are unable to access these services.

2. Secure Access to Technical Assistance

In addition to government assistance, strong opportunities exist for other value chain stakeholders to provide technical assistance and financing for harvesters. Working closely with Blue Star Foods and its subsidiaries, primarily around reducing environmental impacts and improving harvest value, Wilderness Markets has identified a series of technical assistance measures that Blue Star Foods has committed to supporting. These include access to improved pricing, changes in gear to address the ecosystem impacts of gill nets and increasing access to cold storage and ice to improve product quality.

3. Create Access to Financing

Extensive interviews with a range of national and international banks focused on supporting producer organizations revealed considerable barriers to participating in this sector. These included the lack of individual registration, the lack of payment and history records and the lack of harvester aggregation. Furthermore, most banks stated a preference for at least three years’ worth of records and transaction history for producer organizations.

4. Improve Economies of Scale

While harvesters have historically been able to access markets at the collector or mini-plant picking stations, they have done so at a significant disadvantage to their financial interests. Historically, this may not have been an issue to the remainder of the value chain, but increasing concerns regarding quality and sustainability are resulting in a greater focus on the role of mini-plants and their relationships with harvesters. In the blue swimming crab fishery in Indonesia, where over 90% of production is exported into an increasingly global and competitive market, the value chain can no longer afford to ignore the harvesters and if the harvesters are to remain competitive, they must increase their participation.

“In fact production organized based on GVCs [Global Value Chains] and production networks, governed in part through the use of standards, has increased the need for farmers to be organized in order to be included in modern market trade.” –Dr. Eva Csaky, 2014 (3)

A final consideration relates to equity. Across a range of fisheries Wilderness Markets has evaluated, there is a striking lack of any formal organization to represent harvester’s own interests, to aggregate services and access value chains. This has, more often than not, resulted in harvesters being “price takers” for their efforts, while financial benefits have aggregated in the middle of the supply chain.

Conclusion

Wilderness Markets is only too aware of the failure rate associated with cooperatives. A key difference in this case is the close involvement of the value chain partners to ensure market access; a price incentive for improved practices and gear change; and technical support. Building-in a financial incentive for the cooperative and its members to change practices is a key consideration in the process, as is building a financial track record for the organization and its members to permit them to effectively access financing from the formal banking sector in the future.

A key finding of Csaky’s 2014 dissertation (4) was that “Cooperatives are at a disadvantage compared to other producer organization (PO) forms in achieving the conditions of global value chain access.” Additionally, lead firm driven efforts linking smallholders to markets like the international crab market have been more successful than those initiated by producers, i.e., top-down efforts are more successful than bottom-up efforts in these markets. In light of this, Wilderness Markets is actively exploring how the cooperative structure, which is recognized in Indonesia, can be formally partnered with existing value chain actors to effectively achieve financial, social and fishery management objectives to create a hybrid structure.

1. The terms “producer organization” and “cooperative” have different legal implications in different countries. Here we use producer organization in keeping with the original authors language or as an umbrella term that includes multiple forms of producer organizations, including cooperatives.
2. Dalberg. “Farmer Aggregation and Access to Finance”. 2013. Presentation. http://www.ico.org/documents/cy2012-13/forum/forum-3-zook-e.pdf
3. Csaky, Eva Szalkai. (2014). “Smallholder Global Value Chain Participation: The Role of Aggregation” (Unpublished doctoral dissertation). Duke University, Durham, NC. http://dukespace.lib.duke.edu/dspace/bitstream/handle/10161/9384/Csaky_duke_0066D_12557.pdf?sequence=1
4. Ibid

Developing investment opportunities in sustainable marine capture fisheries

Marine fisheries provide an important source of food and livelihoods for millions of people globally, contributing more than US $274 billion to the global economy[1] and some estimates of the potential net gain for improved management at US $600-$1400 billion in present value over fifty years after rebuilding fish stocks[2].

How can governments, development banks, philanthropic grant-makers, and nonprofit organizations create the conditions that will attract and recruit impact investors to participate in the sustainable fisheries sector and contribute to the long-term value of global fisheries? We at Wilderness Markets recently tackled this question as part of our work with World Bank.

The first step is to clearly understand the barriers that keep these investors from engaging with sustainable fisheries and the information they need to evaluate investments. With this knowledge in hand, leaders in government, international development, and philanthropy can align their own funding to create the conditions for more capital to contribute to sustainable fisheries.

The central challenges that keep return-seeking investors from participating in sustainable fisheries fall into four main categories: a lack of fishery data, ineffective fisheries management, unreliable infrastructure systems, and a paucity of investment-ready opportunities.

We propose three potential models for sequencing and combining different sources of capital to overcome these obstacles and achieve sustainable fisheries:

  • Serial Approach: Public and philanthropic funders first support the establishment of strong governance, data collection, and management of a fishery. Based on the de-risking effort of these initial projects, return-seeking investors subsequently fund sustainable infrastructure projects (often in conjunction with public resources) and/or enterprises focused on triple bottom line outcomes.

Investment Models, Serial Graphic

  • Consolidated Approach: Governments negotiate agreements with a single private sector entity or cooperative to delegate fishery management responsibilities. The private firm or cooperative then simultaneously invests in fishery data, management, infrastructure, and triple bottom-line enterprises.

Investment Models, Consolidated Graphic

  • Parallel Approach: A range of investors and other stakeholders (e.g., governments, nonprofit organizations, fishing collectives) develop concurrent and coordinated investments in fisheries data, management, infrastructure, and triple bottom line enterprises. Each effort is separately funded, but they work in tandem and share the ultimate goal of achieving sustainable catch with an appropriately capitalized and profitable fishing sector.

Investment Models, Parallel Graphic

Each of the above sequencing models has pros and cons, and each warrants additional exploration; making return-seeking investments that achieve the triple bottom line outcomes of social, environmental, and economic benefits is early on in it its evolution within the fisheries sector. They hold potential to attract additional funds and encourage private-sector approaches to help speed the transition to sustainable fisheries.

Adapted from: Inamdar, Neel, Larry Band, Miguel Jorge, and Jada Tullos Anderson. Developing Impact Investment Opportunities for Return-Seeking Capital in Sustainable Marine Capture Fisheries. Edited by Ashley Simons. Washington, D.C.: World Bank Group, 2016.

[1] World Bank. 2012. “Hidden Harvest: The Global Contribution of Capture Fisheries.” 66469–GLB. https://openknowledge.worldbank.org/bitstream/handle/10986/11873/664690ESW0P1210120HiddenHarvest0web.pdf?sequence=1

[2] Sumaila, Ussif Rashid, William Cheung, Andrew Dyck, Kamal Gueye, Ling Huang, Vicky Lam, Daniel Pauly, et al. 2012. “Benefits of Rebuilding Global Marine Fisheries Outweigh Costs.” Edited by Julian Clifton. PLoS ONE 7 (7): e40542. doi:10.1371/journal.pone.0040542.

What does stock health tell us about potential investments?

What’s an easy way for an investor to tell if a natural resource-based enterprise is going to be viable in three to five years? Part of that answer lies in evaluating the business and the regulatory environments in which it operates, but for natural resources in particular, the resource base trend needs to be examined; is it predicted that there will be more or less in the future, based on current extraction rates and scientific estimates of the resource level? And for conservation-focused impact investments, how can investors ensure they are not using more than the ecosystem can sustain?

In wild-capture fisheries, this translates to: “Will there be more or less of the fish to harvest in the future? Will my investment exacerbate overfishing?” Less fish to harvest means the effort level, and thus costs, will need to increase to find the remaining fish.

We’ve recently been puzzling through the easiest way for banks and impact investors to gauge the investability of fisheries enterprises, with a focus on Indonesia. Indonesia hosts some of the most biodiverse ocean ecosystems on our planet and is the world’s second largest harvester of wild capture fish. Banks and investors need quick, easily understood data that doesn’t unnecessarily burden their due diligence process but ensures they aren’t contributing to overfishing.

One tool that is already available in many fisheries is the stock assessment status, usually indicated as under- or moderately exploited, fully exploited, or over-exploited. The exploitation levels reflect scientific data on whether the fish in a fishery (the stock) are being sustainably harvested. Fully exploited indicates a stock that is thought to be fished and reproducing at nearly equal rates, i.e., the amount of fish harvested is the same as the fish being hatched and surviving to maturity. Over-exploited means harvest rates are too high, and under-exploited means they could increase rates without having a harmful effect on stocks.

Indonesia’s Ministry of Marine Affairs and Fisheries recently released the results of the National Commission on Stock Assessments (NOMOR 47/KEPMEN-KP/2016 TENTANG). The assessment provides an updated snapshot of ministry data in each fishery management area for the status of nine Indonesian fishery stocks.

Indonesia Stock Status

In addition to focusing government investments on improving the fishery health, we think the data can be useful for banks and investors. The assessment data can help investors quickly determine the potential health of the resource an enterprise relies on, helping to ensure they are not causing more fish to be used than can be replaced. The key to balancing conservation and investment entails finding new opportunities to do more, without using more.

Map of Indonesian Fishery Management Areas (WPP)

Disclaimer

The findings and conclusions in this report represent the interpretations of Wilderness Markets and do not necessarily reflect the view of expert stakeholders. This publication has been prepared solely for informational purposes, and has been prepared in good faith on the basis of information available at the date of publication without any independent verification. Wilderness Markets does not guarantee or warrant the accuracy, reliability, adequacy, completeness or currency of the information in this publication nor its usefulness in achieving any purpose. Charts and graphs provided herein are for illustrative purposes only. Nothing contained herein constitutes investment, legal, tax, or other advice nor is it to be relied on in making an investment or other decision. Readers are responsible for assessing the relevance and accuracy of the content of this publication. this publication should not be viewed as a current or past recommendation or a solicitation of an offer to buy or sell securities or to adopt any investment strategy.

US West Coast Groundfish – Key Market Channels

Continuing our market demand assessment work with US West Coast Groundfish, our partner, Changing Tastes completed an assessment of key distribution channels to prepare for the survey they’ve just initiated. In this post, we discuss what the key distribution channels are, their preferences for fresh and frozen, and why any of that matters.

As we and others have said, the story of US West Coast Groundfish is one of best fish stories you probably haven’t heard. The fishery was declared an economic disaster in 2000, but in 2014 thirteen species were MSC certified in 2014, eight groundfish in the California Groundfish Collective fishery are green-rated by Seafood Watch plus more from the fishery that are green- or yellow-rated. In an effort to increase overall value in the fishery, we’re working with Changing Tastes to help determine who could be purchasing this fish and the key characteristics of demand.

Changing Tastes recently initiated a survey to assess demand, but they had to identify key market channels in order to focus assessment efforts. The following information is based on their work, which they completed using a combination of methods, including:

  • Government data for whitefish consumption
  • Publicly and privately held company data
  • Professional opinion gained from working with some of the nation’s largest restaurant and food service companies and grocers

Total sales of whitefish (a broad category that would include the species landed in the fishery) are estimated at US $542.9 million in the three West Coast states based on US government data, with $442.7 million of that spent in California. Total dollar value of whitefish was second to shrimp, unsurprisingly.


Click to see table of approximate dollar values

Sales and format value comparisons of whitefish in California, Oregon and Washington. Green is the proportion of the value sold fresh; blue is the proportion sold frozen. Size of the graph is relative to the total values of whitefish bought. (“School and government institutions” and “Hotels” are shown larger than their proportion of the total for visibility purposes. Grocery is actually ten times larger than hotel, and 40 times larger than schools and governments.)

These channel categories are generalizations—different companies and brands within each category may use different mixes of fresh and frozen—but the generalizations are useful for determining which channels to concentrate on for survey completion.

Interestingly, an unpublished May 2016 study by Globescan noted that California consumers are 20% more likely than the average national consumer to buy fish from fresh counters in grocery stores.

Click to see table of approximate volumes

Click to see table of approximate volumes

Changing Tastes then screened the channels using their professional opinion on parameters based on the desired outcome of improved values, including their ability of a market channel to:

  • pay a premium for higher quality, local or sustainable
  • use whole or minimally processed fish, frozen or fresh
  • practice seasonality by varying menu options
  • be flexible with species offered

Based on values, volumes and their professional opinion, Changing Tastes is prioritizing receiving feedback from the following channels, and the specialty distributors who supply them:

  1. grocery
  2. full service restaurants
  3. institutional foodservice sub-segment of colleges, corporate dining, and cultural and leisure destinations
  4. hotels

The survey started landing in inboxes last week. By mid-October, we should have more to report about the initial findings. Until then, if you have questions, comments or suggestions, we’d love to hear from you.


What lessons can be learned from the Icelandic cod value chain?

Iceland - Siglufirði Siglufjörður By Hansueli Krapf This file was uploaded with Commonist. [CC BY-SA 3.0 (http://creativecommons.org/licenses/by-sa/3.0)], via Wikimedia Commons

Iceland – Siglufirði Siglufjörður By Hansueli Krapf This file was uploaded with Commonist. [CC BY-SA 3.0 (http://creativecommons.org/licenses/by-sa/3.0)], via Wikimedia Commons

Icelandic cod first came to our attention at Wilderness Markets when we were collaborating with Future of Fish on research into financing needs in the US Northeast Multispecies Sector Program. How can cod from, Iceland, over 2000 miles away be not only cheaper but of equal or better quality than cod caught from just outside your proverbial front door?

A series of papers highlights important developments and key factors in the success of the Icelandic cod value chain since the ‘90s. The series include:

  1. The Effects of Fisheries Management on the Icelandic Demersal Fish Value Chain, 2016[1]
  2. A Comparison of the Icelandic Cod Value Chain and the Yellow Fin Tuna Value Chain of Sri Lanka, 2010[2]
  3. The Role of Fish Markets in the Icelandic Value Chain of Cod, 2010[3]
  4. The Importance of SMEs in the Icelandic Fisheries Global Value Chain, July 2009[4]
  5. Structural Changes in the Icelandic Fisheries Sector – A Value Chain Analysis, 2008[5]

Before digging in too far, two aspects of the Icelandic versus the New England value chains can’t be overlooked—the relatively small population of Iceland and the relatively high landings of cod.  For disputed reasons (climate change, better management, etc.) Iceland has a much healthier, i.e. more abundant stock, and hundred-fold greater landings than New England. Along with much higher landings, a far lower population means a robust export market.

2016-06-23

[6]

Key factors and developments:

  • Increased efficiency at multiple levels of the value chain has helped improve value
  • Domestic value creation, specifically in the form of fresh fillets, has added significant value
  • Information flow (availability of information) and knowledge drive value
  • Use of marketing information to govern the value chain through vertical integrated companies and fish auction markets
  • Fish markets (auctions) improve efficiency and improve the consistency of supply for the value chain by acting as clearinghouses and support speculation
  • Consolidation of vessels, fishermen, processors, processing workers, and quota ownership have occurred in significant number
  • Increased specializations in fishing and processing

An interesting aspect that warranted a whole paper is the role of the fish markets, effectively online auctions, wherein all bidding is done through one computerized system owned by 15 independent markets since 2000. These private markets only handle 20% of the landings by volume but have a high value in terms of value chain efficiency because they allow for specialization (buyers can sell or swap species not needed for production), provide stability (buyers can ‘top-up’ if they are short on supply) and creates market-driven value for species. The rise in general groundfish prices by 20% from 1999 to 2008 is thought to be partially attributed to the fish market system.

Some key aspects of the Icelandic cod value chain, like low human population in Iceland and abundance of target species in their waters, don’t readily translate to Wilderness Markets’ recent focus on the Indonesian and U.S. West Coast fisheries. Others do. For instance, in the paper on the importance of small and medium enterprises (SMEs), the increase in vertically integrated companies means those companies have better control of the reliability, quality and delivery of fisheries products. Their competitive advantages are related to quality assurance knowledge, good logistics and dedicated export and sales management. On an almost reverse timeline for the U.S. West Coast groundfish fishery in California, fish handling in Iceland improved in the ‘90s and ‘00s by investments in better onboard cooling systems, shorter fishing trips and logistics improvements.

In the 2016 paper, they also describe the structure of the value chain before the export licensing system was abolished in the 1980s—importantly, and with implications for other value chains – the three large marketing and sales organizations that controlled most of the fish failed to send market signals back to producers. The new, vertically integrated companies that replaced these organizations heeded signals from foreign customers and improved product quality and successfully added value domestically by switching processing to Iceland instead of overseas.

We have witnessed this same disconnect in many other fisheries; fishermen don’t seem to have any idea about the needs and demands of the end markets and have no incentive to meet these demands. In one of the most telling statements in the series, an interviewee states, “They [the Norwegians] are still mostly thinking about catching while we have reached the point where we think about serving the market.” Most fishermen have not yet been able to reach this stage, hindering their ability to realize improved value for their work.

We’re hopeful that the end-market research currently underway in California will provide market data that can be turned into increased value for the harvesters working diligently to promote sustainability.

[1] Knútsson, Ö., Kristófersson, D. M., & Gestsson, H. (2016). The effects of fisheries management on the Icelandic demersal fish value chain. Marine Policy63, 172-179..

[2] Knútsson, Ö., Gestsson, H., Klemensson, O., Thordarson, G., & Amaralal, L. (2010). A Comparison of the Icelandic Cod Value Chain and the Yellow Fin Tuna Value Chain in Sri Lanka.

[3] Knútsson, Ö., Klemensson, Ó., & Gestsson, H. (2010). The Role of Fish-Markets in the Icelandic Value Chain of Cod.

[4] Knútsson, Ö., Gestsson, H., & Klemensson, Ó. (2009, July). The importance of SMEs in the Icelandic fisheries global value chain. In IXX EAFE Conference Proceedings (pp. 6-9).

[5] Knútsson, Ö., Klemensson, Ó., & Gestsson, H. (2008). Structural changes in the Icelandic fisheries sector-a value chain analysis.

[6] New England Population: http://www.dlt.ri.gov/lmi/census/pop/neweng.htm
Iceland Population: http://www.iceland.is/the-big-picture/quick-facts

US landings: http://www.st.nmfs.noaa.gov/commercial-fisheries/commercial-landings/annual-landings/index
Icelandic landings: http://icefishnews.com/wp-content/uploads/2013/05/Marko-partners-%C3%ADslenski-kv%C3%B3tinn.png


Groundfish Market Demand in California

We’re pleased to announce that Changing Tastes and Wilderness markets will be collaborating to carry out the market research for groundfish in California announced in our RFP. Having robust data about business and institutional buyers close to the consumer will address one of the key information gaps we identified in our value chain analysis; the ultimate goal of the work is to improve the economic value of products from this fishery. 

Read more

Sustainable Fisheries Investments: Lessons from the Field

Three years ago, we set out to to explore a perceived anomaly in the impact investment market. While sectors such as carbon and agriculture were attracting a range of capital investment in sustainable fisheries appeared to be neglected. Given the geographic scope, industry scale and potential impact, we wanted to understand the reasons behind the lack of capital.

Our conclusion, following three years of field based research and due diligence in three countries, five fisheries, and over 220 interviews with financial, corporate, government, community and NGO representatives, identified the following key constraints:

  • Data
  • Management
  • Market differentiation
  • Infrastructure
  • Finance
  • Lack of investable entities

The first two, data and management, are the most pressing constraints to the effective deployment of capital at scale in developing country fisheries (DCFs), as discussed in our recently released report, “Connecting the Dots”. Each need to be addressed simultaneously if  equitable participation of the harvester is important to investors.

Concerning specific investments, there’s a fundamental need to distinguish between who and what benefits from value chain investments and investments in the drivers of stock health. While a healthy value chain benefits from a healthy stock, the benefits do not cut both ways, that is, a healthy value chain does not necessarily make stocks healthier; the drivers of stock health must be addressed.

Another general assumption holds that by changing the practices of one or two players in the value chain, we can secure stock health – this was found to be exceedingly unlikely in the open access system of fisheries which suffer from the tragedy of the commons. Addressing artisanal tuna harvester needs is socially and potentially economically positive, but it is difficult to prove environmental benefits if the next village over has unrestricted access – along with the purse seine factory fishing boat from the country next door!

The drivers of stock health are all external to the value chain, and, unfortunately, most financial interventions are reliant on the value chain in order to secure repayment. This disconnect is seldom recognized by practitioners, and it is often assumed that by changing the practices of one or two players in the value chain, we can secure stock health. At the other end of the spectrum are improvements aimed at stock health and improved socio-economics for fishing communities that rely on the “build it and they will come” theory, failing to integrate harvesters and buyers into improvements.

Our findings are that value chain based investments in open access systems are unlikely to improve environmental outcomes, and, in practices, are likely to accelerate resource extraction, in some cases, of already pressured stocks and resources.

Our research also identified significant investments in fisheries are an ongoing reality in many DCFs. Whether from the private sector (DDI and DFI data), and from national governments, fisheries are well capitalized.

The inequality experienced by artisanal harvesters is not, in our view, an issue of capital. It is a systemic failure, requiring multiple components be addressed simultaneously

There is an urgent need to focus efforts on improving the drivers of stock health in DCFs, over and above deploying yet more capital into the value chain without investment in stock health.

Markets for Groundfish in California, Part 4 of 4

This is part 4 of a 4-part series intended to invite conversations in advance of our planned end market demand analysis for groundfish in California. The larger goal is to provide quantified end market data to inform profitable value chain investments that will positively impact harvesters, local communities and the ocean.

Waste and discards

The opaquest parts of the value chain are the discard and waste streams; we don’t have volume figures to distinguish between discards and processing trimmings and how much of each goes to secondary processors or to landfills. We believe this to be important given the high level of biomass discarded – in some cases as much as 70% of the landed fish (e.g. Dover sole, which has one of the higher quotas).

We identified one secondary processor and were told that disposing of processing byproducts is not a moneymaker; indeed, disposing of trimmings is a cost for processors which may be passed to harvesters. Just how much of a cost is unknown. Also unknown is what proportion is sent to the secondary processor and how much may be destined for landfill. In addition, we don’t know what volume of fish or fish waste enter this stream since the final end-market forms for domestic consumption is unknown (and thus how much fish is processed or sold whole is unknown).

A potential local solution to unvalued fishery byproducts was initiated in Morro Bay in which local farmers picked up bins of fish parts and turned them into soil amendment. However, discovery of state regulations that limit processing of the fish parts prohibited the continuation or expansion of the program.[1]

Questions: Would improving the value of discards and trimmings improve the value realized by harvesters? Is this a viable alternative market?

Final Thoughts

The West Coast Groundfish fishery could be a case study for successful fisheries management for hundreds of other fisheries around the world if it weren’t for the fact that so many harvesters still seem to be struggling economically. Until the harvesters are profitable enough to cover management costs, the most important part of the puzzle isn’t in place. Figuring out where the different pieces fit—value drivers, product flows and the like—will be a boon not only to these harvesters and their communities, but also to parties interested in investing in this, and other, fisheries.

[1] Kathy Johnston, “Hook, Line, and Sinker,” New Times, December 7, 2011, Volume 26, Issue 19 edition, http://www.newtimesslo.com/news/7042/hook-line-and-sinker/.

Markets for Groundfish in California, Part 2 of 4

This is part 2 of a 4-part series intended to invite conversations in advance of our planned end market demand analysis for groundfish in California. The larger goal is to provide quantified end market data to inform profitable value chain investments that will positively impact harvesters, local communities and the ocean.

Export markets

How much California groundfish is exported and how much stays?

Fig1[1][2]

Although we have data from NMFS for exports from California ports, it’s not an apple-to-apples comparison to NMFS landings data, making it difficult to understand how much fish likely stays in California and how much fish exported from California actually was caught in California. The export data doesn’t divide export volumes and values by species, like the landings data does, but instead lumps it into broad categories for most species. For example, Dover sole and petrale sole, which are each reported in California landings, are lumped in the export category “flatfish”. This makes it hard to characterize demand for groundfish by end market preferences—we don’t know how much Dover stays in California or in the U.S., and how much is exported.

Another comparison conundrum is that the exports from California ports appear to include fish landed outside California waters. We did not include exports of pollock, haddock and cod since these are not recorded in the California landings data for the time period we compared. After filtering these out, there are relatively small volumes of groundfish (8-19%) exported as compared to landings in Figure 1.

Are there more money-makers like sablefish?

One bright point, in terms of value to the groundfish fishery, is sablefish. Sablefish seems to be driving not only value but volumes of exports from California. The average unit value (simply the landings value divided by the volume) for sablefish landings in California were usually twice as much as other groundfish from 2008 to 2014.For the same time period, the ratio of sablefish landed to sablefish exported averaged 24%, compared to 1 to 10% for most groundfish. Of course, this isn’t a wholly accurate comparison: since the sablefish exported from California may not have been landed there.

More than 90% of all exported sablefish over the time period assessed go to Japan, most of the sablefish going to Japan is frozen. Sablefish is doubly interesting because of this—not only are high value exports a rarity in this fishery, but so are high value frozen products.

Remaining questions include: Are there other species that can capitalize on the export market to Japan? Are there other species or markets that would have similar characteristics—a high value fish, exported in frozen form—where this success could be replicated?

Why does it seem that extremely low value groundfish is being exported?

Fig2

Another interesting comparison is the unit values of landings and exports in California, based on the same data provided by NMFS. We expect that export unit values would be higher than landing unit values, since they are likely processed and value-added. But for groundfish other than flatfish and sablefish, this expectation isn’t met. From 2008 through 2011, groundfish other than flatfish and sablefish had a higher unit value for landings than for exports.

There are a number of potential causes for this disparity:

  • We’re comparing different species. The “other groundfish” category that’s being exported is comprised of different species than the ones in the landings data. Perhaps these are low value species landed outside California and brought to California and exported.
  • Groundfish exports are lumped into a category other than “groundfish” for these years. Perhaps they’ve been exported in a product form that does not identify the type of fish.
  • Low value groundfish can’t be sold domestically. The groundfish being exported doesn’t match the domestic market demands and so the only market is a very low paying international market. Figure 3 compares the top five destinations for California groundfish.(Note that the Netherlands (NLD) appears to accept many low value imports in 2014.) Other than Japan, potential high value markets to explore include Vietnam and Canada. However, both these countries imported small amounts, albeit at high value, in 2014.

Fig3

[1] NMFS, “Commercial Landings,” page, Commercial Fishery Statistics, (2015), http://www.st.nmfs.noaa.gov/commercial-fisheries/commercial-landings/index
[2] NMFS, “Trade by Country,” page, Commercial Fishery Statistics, accessed February 18, 2015, http://www.st.nmfs.noaa.gov/commercial-fisheries/foreign-trade/applications/trade-by-country