Posts

Improve Data to Improve Sustainability

Case Study:
Developing and Implementing SIMP Compatible Seafood Data Reporting and Traceability System in the Crab Supply Chain

Problem Statement and Opportunity

The U.S. implementation of the Seafood Import and Monitoring Program (SIMP)[1] on 1 January 2018 establishes reporting and recordkeeping requirements to prevent illegal, unreported and unregulated (IUU) seafood from entering the U.S. The onus of proof is placed on the importer of record to provide and report key data from harvest to U.S. entry. In geographically diffuse supply chains, like blue swimming crab from Southeast Asia, with thousands of “points of entry”, i.e., fishers, tracking landings to the vessel is far less straightforward than short and narrow supply chains, such as skipjack tuna or sardines. This reporting requirement, while worthwhile, will require U.S. seafood importers to incorporate cost-effective traceability initiatives in their often-complex supply chains.

There is a growing appreciation that the needs of fishers and their communities must be addressed in order to improve the underlying causes of fishery exploitation in the developing world, particularly for small-scale fisheries. -California Environmental Associates

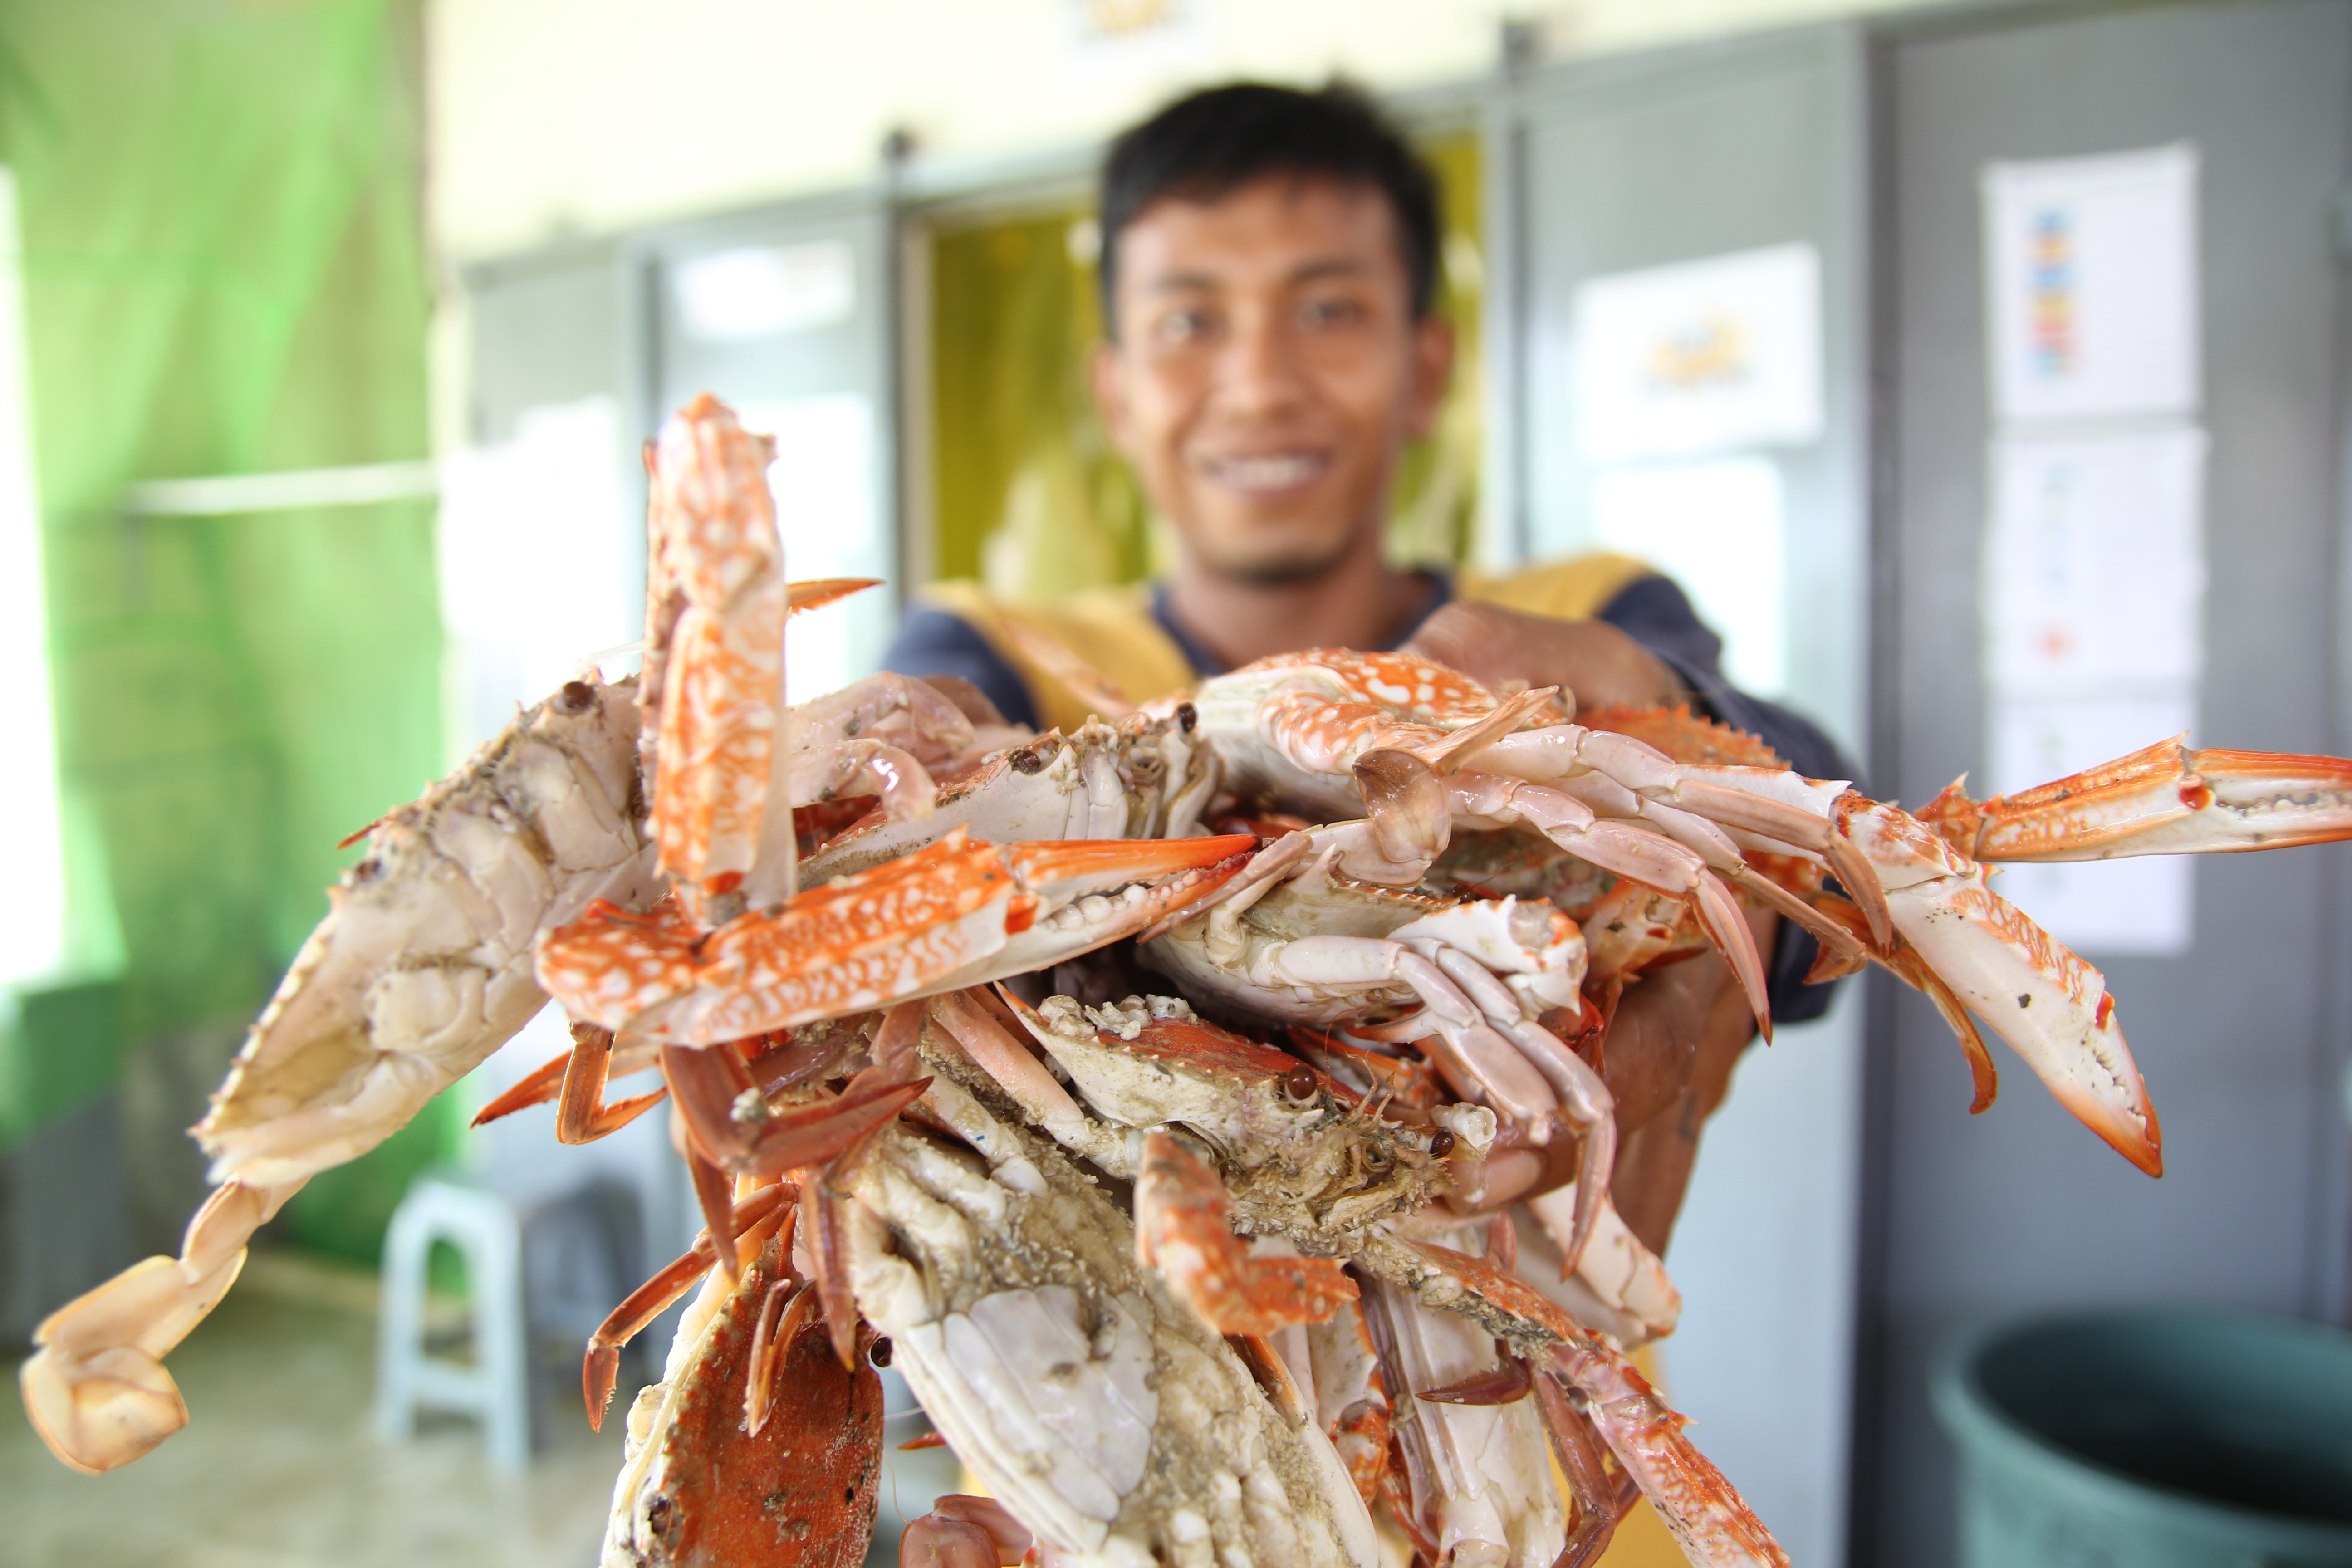
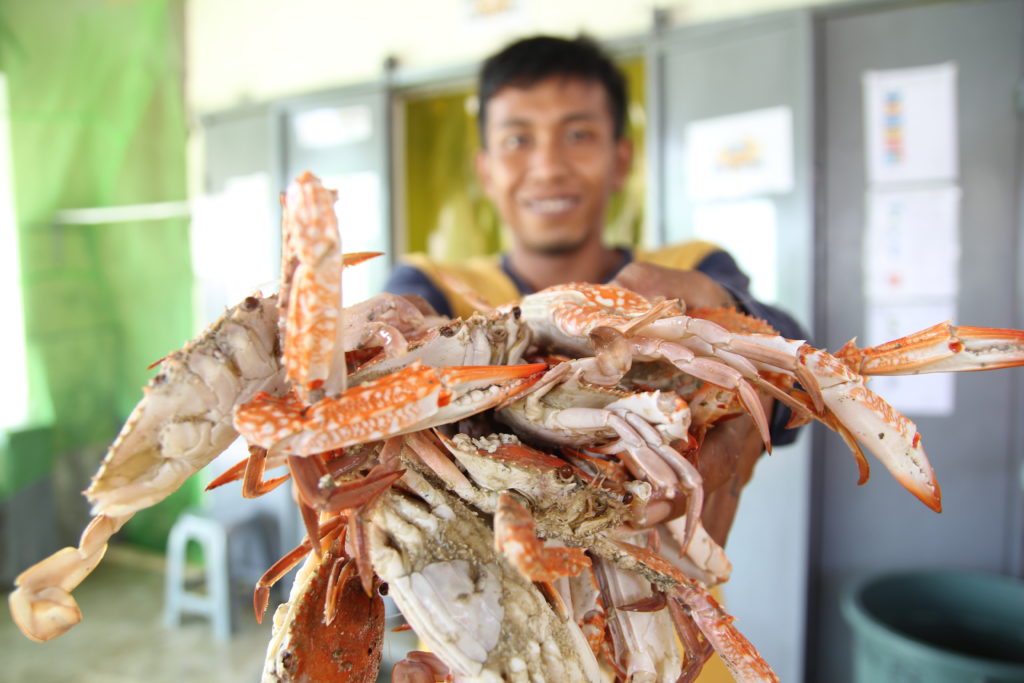
The requirement also presents an opportunity to promote resource sustainability through supply chain transparency and catch monitoring. Despite pledges to abide by size limits, U.S. importers of blue swimming crab (BSC) have difficulty ensuring their supply chain partners are buying only crabs larger than the agreed minimum size of 10cm and excluding berried females. The application along with a web-based reporting tool we developed can meet the requirements of the SIMP, as well as the European Catch Documentation (CD) requirements, and elucidate the in-country supply chain. By tracking landings by vessel and by harvester, this tool further provides the opportunity to address key social and environmental outcomes associated with the Sustainable Development Goals[2] (SDGs), which gives seafood importers a mulit-purpose toolkit to both decrease their reporting costs and increase the sustainability of the crab stocks.

The opportunity to spur social and economic impact should not be underestimated. Educating, engaging and rewarding fishers and communities directly for complying with ecological goals like minimum size, berried females, no-take areas, and more offers an opportunity to engage communities directly in resource management and provide key links to SDGs. Aside from nascent work by Fair Trade[3] and SmartFish[4], there are few fishery sustainability efforts that actually benefit the fishers that form the foundation of many supply seafood chains. Indeed, most efforts impose costs on fishing communities—time, foregone income, capital for new equipment—without providing benefits. Our tool allows identification of compliant fishers, so they can be awarded price premiums and other incentives.

Supply chain transparency is beneficial to the U.S. importer not only in terms of identifying good actors and meeting reporting requirements, but also gives them an edge in the marketplace full of otherwise opaque supply chains.

Provision of ice is a key concern

Assessment

When initially considering how to provide BSC supply chain transparency from the ocean to the end buyer, we researched existing options, hoping to find one that could be customized to the supply chain. We conducted a desk review, scouring the internet and our personal network to identify all available options. In total, we reviewed nearly forty systems that provided varying levels of traceability; of these, we interviewed approximately six potential providers that met or came close to our key considerations:

  1. Ease of use – the user interface needed to be easy for data collectors in Indonesia and importers in the U.S. to use
  2. Utility for marketing purposes – a consumer-facing component was a must
  3. Facilitate regulatory compliance – must collect and provide data required by the SIMP and EU CD in a straightforward format
  4. Mapping – needs to provide maps of fishing locations to determine which areas are best for avoiding undersized and berried crabs
  5. Business model – a cost effective and durable business model that did not result in excessive fees or costs to each level of the value chain
  6. Data access, storage and ownership – data must be accessible by multiple parties within the value chain, stored in Indonesia, and owned by the funding company
  7. Reasonable set-up costs – ideally, a system would be compatible with existing software and hardware and would require little in the way of training. A team should be able to begin data collection with a few hours or less of upfront training on the system interface and they should be able to readily convey to the fishers the benefits of the system.
  8. Geographic and cultural relevance – the system needed to function in rural, relatively isolated areas with little to no telecommunications access
  9. Engage Harvesters and Vessel owners in order to build their understanding and the relative importance of adhering to harvest control regulation
  10. Ease of integration – overall, the platform needed to be easy to readily integrate into the supply chain.

Findings from Assessment

None of the reviewed systems met the requirements of the lead firm with the exception of the Pelagic Data Systems units for vessel management, i.e., vessel tracking. Due to the cost of acquisition and the relatively high ongoing costs of use, these were installed on a trial basis. This test was not successful, and cheaper, more effective units were identified.

Development

Not finding a suitable existing program, Blue Star Foods decided to develop their own application to gather data tied to their marketing goals and objectives around supply chain integrity. The SIMP and EU CD data requirements were integrated into the data collection system. Wilderness Markets worked closely with an app-development team to develop an Android and iOS  application and support the field trials. After the initial field trials, the system was deployed to in-house teams from Blue Star Foods Indonesian partners, consisting of procurement and quality control specialists.

Implementation and Deployment

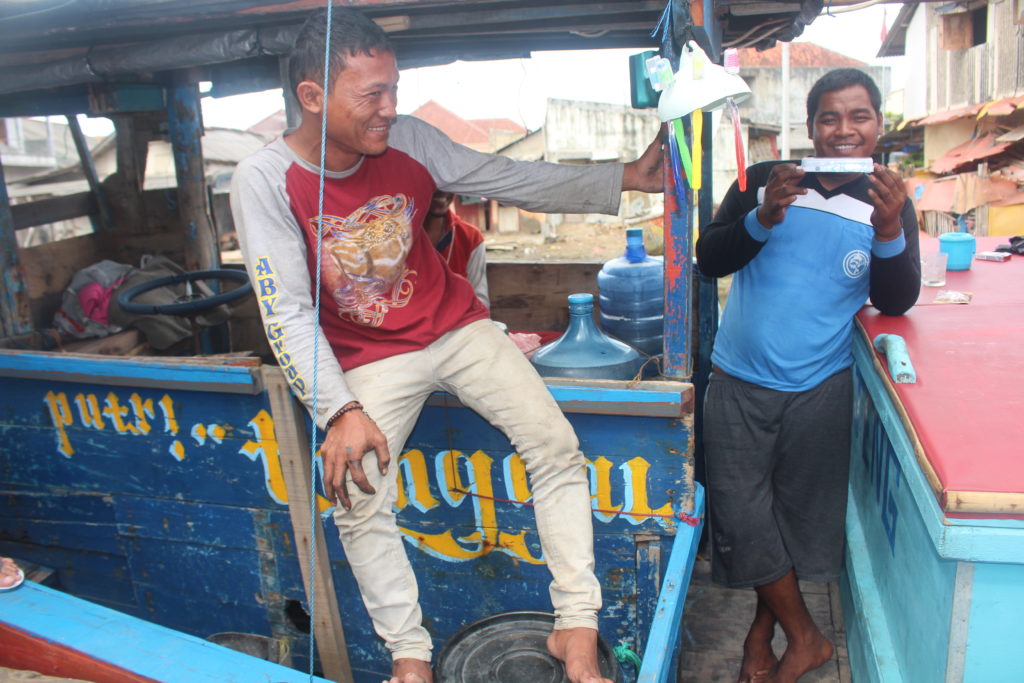
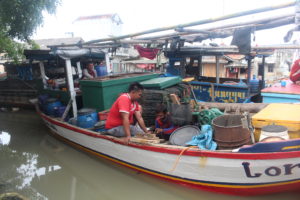
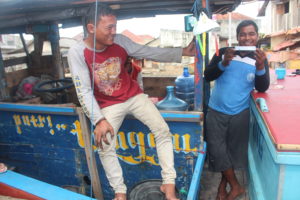
Data was collected at selected mini-plants and landing sites during a six-month period. Both harvesters and data collectors were simply encouraged to log landings during the pilot phase without any indication or reference to IUU or other considerations. They were not penalized or otherwise reprimanded for reporting undersized or berried crabs during this time period. Vessel tracking data was collected for a select number of boats during this period, which could be matched to landings data.

Parallel Approach

Sumatran Fisherman with Blue Swimming Crabs

Initial learning points

  • Data collection required additional training of procurement and quality control teams. This in turn required an additional budget to be implemented effectively.
  • The pilot only covered a small portion of overall U.S. imports from Indonesia (less than 1%) – the current opacity of the supply chain means we did not know how much each mini-plant contributes to the supply chain before the pilot
  • The system efficiency is high enough that recording all landings at a mini-plant or at a landing site is possible, though unless a quality control individual is onsite continually, it cannot guarantee there will be no side selling unless all buyers agree to use the system.
  • The data feedback loop to management has been significantly shortened and is possible in nearly real-time allowing:
    • Faster identification of low productivity landing sites
    • Faster identification of high productivity landing sites
    • Faster identification of undersized and/or berried crab seasons and locations
  • Data integrity and accuracy continues to be an issue and needs to be worked on – Due to their small size, most vessels are unregistered so vessel identification is challenging. Usual data integrity and accuracy issues for data collection operations exist, such as ensuring consistent data entry, checking entries for errors, etc.

Initial Data Findings

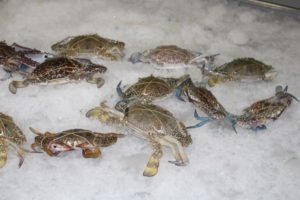
  • Initial indications, based on sampling approximately 10% of the harvest per vessel, are that up to 25% of landings can likely be classified as IUU (berried females & sub 10cm).
  • Boats with lowest supply chain loyalty appear to have higher levels of IUU (an assumption to be tested in additional sites)
  • It is now possible to identify the specific boats that are causing the high levels of infractions, and to address with through the supply chain in a focused manner.
  • Less than 20% of the surveyed vessels were responsible for 80% of the IUU landings

Fishery Management Implications

The ability to specifically identify vessels not complying with agreed harvest controls will permit a more targeted, focused and cost-effective approach to monitoring and enforcement of infractions. With less than 20% of the vessels are causing 80% of the issues with regards to IUU landings, efforts can be made to reduce IUU in a focused manner.

The data provides:

  • Ability to provide shore-based landing information
  • Ability to identify both geographic and seasonal potential closure options based on real data
  • Ability to target enforcement based on recorded infractions
lead firm crab

BSC fisherman with new vessel tracking device

Links to SDGs

In addition to the business and fishery management implications, the findings are directly linked to at least three SDGs:

SDG 8 Decent Work and Economic Growth

Promote sustained, inclusive and sustainable economic growth, full and productive employment and decent work for all

Biological data indicates a quick (less than 1 year) stock recovery when undersized crabs are left in the water, thereby increasing the economic value of the fishery and decoupling growth from environmental degradation (Target 8.4)

SDG 9 Industry, Innovation and Infrastructure

Build resilient infrastructure, promote inclusive and sustainable industrialization and foster innovation

Increasing the transparency of the supply chain means that small-scale enterprises, like the mini-plants, can have better access to financial services (Target 9.3).

SDG 14 Life Below Water

Conserve and sustainably use the oceans, seas and marine resources for sustainable development

Using the data generated by the app, progress can be made towards sustainably managing fish stocks, combatting IUU, and providing meaningful market access for small-scale artisanal fishers (Targets 14.4, 14.6 and 14.B).

Recommendations and Next Steps

A key recommendation of the initial pilot is the need to establish unique vessel IDs with the support of local government authorities, which will allow more meaningful monitoring and enforcement of landings.

In addition, the need to engage with, and involve, other firms purchasing from the fishery was identified in order to reduce the opportunities for side selling.

A second phase is being planned to address the constraints of the first. The goal of the second phase is to:

  • Capture a minimum of 25% of the Blue Star Foods Indonesia sourcing;
  • Integrate improved vessel activity geographic data
  • Expand geographically
  • Include more processors, mini-plants and fishers in Indonesia, particularly in co-packer conditions
  • Replicate into the Blue Star Foods Philippine supply chain

Conclusion

The drivers of market access compliance requirements, improved social and financial impact in in artisinal fisheries and greater supply chain integration are powerful drivers for change in any industry. The relatively low cost now associated with data capture tools mean lead firms can utilize almost ubiquitous cell phone availability to cost effectively assess the degree and extent of IUU in their supply chain, while strengthening their impact objectives and improving market recognition.

This approach provides resource managers and NGOs as well as development agencies with a relevant, cost effective tool to engage private sector supply chains in achieving SDGs in a measurable, informed and data driven manner.


[1] “U.S. Seafood Import Monitoring Program”. Retrieved on 7 March 2018 from: https://www.iuufishing.noaa.gov/RecommendationsandActions/RECOMMENDATION1415/FinalRuleTraceability.aspx

[2] “Sustainable Development Goals”. Retrieved on 19 March 2018 from https://sustainabledevelopment.un.org/?menu=1300

[3] “Capture Fisheries Standard (CFS)”. Retrieved on 8 March 2018 from: https://www.fairtradecertified.org/business/producer-certification

[4] “Rescate de Valor”. (English: Value Rescue) Retrieved on 8 March 2018 from: http://rescatedevalor.org/

Lead Firm Strategy Implementation – Indonesian Blue Swimming Crab

Overview

In 2015, Wilderness Markets completed a value chain summary of the blue swimming crab (BSC) fishery in Indonesia in which we analyzed the current state of fishery data systems, resource management, infrastructure, and enterprise capacity. Based on these findings, we recommend a lead firm strategy to move the fishery toward sustainability. Like many fisheries in emerging markets, the Indonesian BSC fishery lacks reliable data and, despite new national policies, functions largely without effective management. The value chain has strong, established commercial and social relationships, indicative of the power and influence of a small group of 16 processors buying from 400 mini-plants that, in turn, purchase crab from more than 65,000 fishermen.

In this case, the lead firm is a U.S. based company, Blue Star Foods. Blue Star is working to create financial and social incentives to enable fishermen to transition faster to sustainable fishing practices. Through its purchasing power and relationships, Blue Star is therefore in strong position to influence the practices of a range of processors, who have commercial relationships with a network of mini-plants, collectors, and fishermen.

BSC traps

Sumatran vessel with collapsible traps

Lead Firm Pilot Design

With Blue Star and local harvesters, we are developing an investment model based on a pilot partnership between the lead firm and a fishing cooperative (in development). The model brings together philanthropic and private capital and provides financial, social, and environmental returns. It includes:

  • Purchase commitments based on price, quality and standards
  • Investments in fishermen cooperatives to motivate gear improvements
  • Improved fishery data collection and traceability
  • Support for harvest control compliance

This pilot is designed to attract private, return-seeking impact investment and complement ongoing work by NGOs to improve fishery management. We expect this approach will enable local fishermen to adopt sustainable practices faster than waiting for the government to independently create and enforce management changes, and without the economic hardship for fishermen that often accompanies changes in fishery regulations. It will also bolster business advocacy for more effective fisheries management policies and enforcement through a local cooperative structure.

lead firm crab

BSC fisherman with new vessel tracking device

Goals and expected outcomes

Ultimately, as a result of better data collection and effective management, the fishery will produce higher yields of BSC. It will also provide a traceable, sustainably harvested product with a competitive advantage in key U.S. and E.U. markets. This will then allow Blue Star and supporting investors to recoup their investments in sustainable practices.

By embedding this lead firm work within existing value chain relationships and practices, we aim to:

  • Demonstrate the financial viability of investments in fishery data collection and management, thus attracting additional private investment in these practices.
  • Create new norms that are sustained because of their business value and not ongoing philanthropic support or government subsidies.
  • Provide clear and reliable financial benefits for small-scale fishermen to make gear changes; follow harvest control measures; and take on other sustainable fishing practices. Immediate economic well-being is thereby aligned with sustainable practices to improve compliance and reduce the localized short-term, negative impacts of fishery restrictions.
  • Finally, test a new, “parallel” investment model for combining philanthropic, government, and private sector funding to address fishery management. If successful, other emerging market fisheries can tailor the model.

We are currently seeking additional partners to join us in this lead firm pilot project. Please get in touch with us if you would like more information and/or would like to get involved.

What lessons can be learned from the Icelandic cod value chain?

Iceland - Siglufirði Siglufjörður By Hansueli Krapf This file was uploaded with Commonist. [CC BY-SA 3.0 (http://creativecommons.org/licenses/by-sa/3.0)], via Wikimedia Commons

Iceland – Siglufirði Siglufjörður By Hansueli Krapf This file was uploaded with Commonist. [CC BY-SA 3.0 (http://creativecommons.org/licenses/by-sa/3.0)], via Wikimedia Commons

Icelandic cod first came to our attention at Wilderness Markets when we were collaborating with Future of Fish on research into financing needs in the US Northeast Multispecies Sector Program. How can cod from, Iceland, over 2000 miles away be not only cheaper but of equal or better quality than cod caught from just outside your proverbial front door?

A series of papers highlights important developments and key factors in the success of the Icelandic cod value chain since the ‘90s. The series include:

  1. The Effects of Fisheries Management on the Icelandic Demersal Fish Value Chain, 2016[1]
  2. A Comparison of the Icelandic Cod Value Chain and the Yellow Fin Tuna Value Chain of Sri Lanka, 2010[2]
  3. The Role of Fish Markets in the Icelandic Value Chain of Cod, 2010[3]
  4. The Importance of SMEs in the Icelandic Fisheries Global Value Chain, July 2009[4]
  5. Structural Changes in the Icelandic Fisheries Sector – A Value Chain Analysis, 2008[5]

Before digging in too far, two aspects of the Icelandic versus the New England value chains can’t be overlooked—the relatively small population of Iceland and the relatively high landings of cod.  For disputed reasons (climate change, better management, etc.) Iceland has a much healthier, i.e. more abundant stock, and hundred-fold greater landings than New England. Along with much higher landings, a far lower population means a robust export market.

2016-06-23

[6]

Key factors and developments:

  • Increased efficiency at multiple levels of the value chain has helped improve value
  • Domestic value creation, specifically in the form of fresh fillets, has added significant value
  • Information flow (availability of information) and knowledge drive value
  • Use of marketing information to govern the value chain through vertical integrated companies and fish auction markets
  • Fish markets (auctions) improve efficiency and improve the consistency of supply for the value chain by acting as clearinghouses and support speculation
  • Consolidation of vessels, fishermen, processors, processing workers, and quota ownership have occurred in significant number
  • Increased specializations in fishing and processing

An interesting aspect that warranted a whole paper is the role of the fish markets, effectively online auctions, wherein all bidding is done through one computerized system owned by 15 independent markets since 2000. These private markets only handle 20% of the landings by volume but have a high value in terms of value chain efficiency because they allow for specialization (buyers can sell or swap species not needed for production), provide stability (buyers can ‘top-up’ if they are short on supply) and creates market-driven value for species. The rise in general groundfish prices by 20% from 1999 to 2008 is thought to be partially attributed to the fish market system.

Some key aspects of the Icelandic cod value chain, like low human population in Iceland and abundance of target species in their waters, don’t readily translate to Wilderness Markets’ recent focus on the Indonesian and U.S. West Coast fisheries. Others do. For instance, in the paper on the importance of small and medium enterprises (SMEs), the increase in vertically integrated companies means those companies have better control of the reliability, quality and delivery of fisheries products. Their competitive advantages are related to quality assurance knowledge, good logistics and dedicated export and sales management. On an almost reverse timeline for the U.S. West Coast groundfish fishery in California, fish handling in Iceland improved in the ‘90s and ‘00s by investments in better onboard cooling systems, shorter fishing trips and logistics improvements.

In the 2016 paper, they also describe the structure of the value chain before the export licensing system was abolished in the 1980s—importantly, and with implications for other value chains – the three large marketing and sales organizations that controlled most of the fish failed to send market signals back to producers. The new, vertically integrated companies that replaced these organizations heeded signals from foreign customers and improved product quality and successfully added value domestically by switching processing to Iceland instead of overseas.

We have witnessed this same disconnect in many other fisheries; fishermen don’t seem to have any idea about the needs and demands of the end markets and have no incentive to meet these demands. In one of the most telling statements in the series, an interviewee states, “They [the Norwegians] are still mostly thinking about catching while we have reached the point where we think about serving the market.” Most fishermen have not yet been able to reach this stage, hindering their ability to realize improved value for their work.

We’re hopeful that the end-market research currently underway in California will provide market data that can be turned into increased value for the harvesters working diligently to promote sustainability.

[1] Knútsson, Ö., Kristófersson, D. M., & Gestsson, H. (2016). The effects of fisheries management on the Icelandic demersal fish value chain. Marine Policy63, 172-179..

[2] Knútsson, Ö., Gestsson, H., Klemensson, O., Thordarson, G., & Amaralal, L. (2010). A Comparison of the Icelandic Cod Value Chain and the Yellow Fin Tuna Value Chain in Sri Lanka.

[3] Knútsson, Ö., Klemensson, Ó., & Gestsson, H. (2010). The Role of Fish-Markets in the Icelandic Value Chain of Cod.

[4] Knútsson, Ö., Gestsson, H., & Klemensson, Ó. (2009, July). The importance of SMEs in the Icelandic fisheries global value chain. In IXX EAFE Conference Proceedings (pp. 6-9).

[5] Knútsson, Ö., Klemensson, Ó., & Gestsson, H. (2008). Structural changes in the Icelandic fisheries sector-a value chain analysis.

[6] New England Population: http://www.dlt.ri.gov/lmi/census/pop/neweng.htm
Iceland Population: http://www.iceland.is/the-big-picture/quick-facts

US landings: http://www.st.nmfs.noaa.gov/commercial-fisheries/commercial-landings/annual-landings/index
Icelandic landings: http://icefishnews.com/wp-content/uploads/2013/05/Marko-partners-%C3%ADslenski-kv%C3%B3tinn.png


Markets for Groundfish in California, Part 3 of 4

This is part 3 of a 4-part series intended to invite conversations in advance of our planned end market demand analysis for groundfish in California. The larger goal is to provide quantified end market data to inform profitable value chain investments that will positively impact harvesters, local communities and the ocean.

Can local demand be met with local fish AND will it increase prices paid to harvesters?

Determining the consumption of seafood products in California with any precision, much less the product characteristics or species composition, is difficult. Considering average per capita seafood consumption in the U.S. is 14.6 pounds per person and 2014 California population is an estimated 38.8 million people, expected seafood consumption in California is about 257,000 metric tons. This is about 38 times the groundfish landings in 2014.  

Estimates from 1993 through 2004 show that estimated consumption of flatfish, a subcategory of groundfish that includes fish like Dover and petrale sole, should be 5,300 metric tons in California. [1] Compare this to the 2,845 metric tons of flatfish landed in California in 2014 and you realize it’s far less than estimated consumption and even lower when processing is considered. Again, this indicates a substantial market that would be interested in purchasing groundfish.

Another strong indication comes from recent work by Changing Tastes.[2] “Whitefish” and “other” currently compose 20% and 15% of U.S. consumer purchases from all sources. Whitefish is a generic and nebulous category, but groundfish species should fall somewhere in either “Whitefish” or the “other” category. The math again indicates a substantial market–about 90,000 metric tons of “Whitefish” and “other” are expected to be consumed in California each year.

All the data indicate there should be a local market for California groundfish, at least based on estimated consumption volumes. However, the characteristics of demand are largely unknown, so we’re unsure whether this is true once product characteristics like flavor and texture are accounted for.

What affect are imported groundfish having on prices?

Despite the data indicating a fairly substantial market for seafood in California, prices in real dollars have remained flat or even declined at some California ports. If there were local market demand, we would expect to see prices at least hold steady, if not increase.

Figure 4 California price comparisons adjusted for inflation, sablefish, Dover and petrale sole, 2008-2014

Fig4

Figures 5 and 6 Price comparisons at major California groundfish trawl ports, adjusted for inflation, petrale and sablefish, 2008-2014

Price graphs

When the unit values of flatfish and other groundfish imported into California are compared to groundfish exported from California, as in Figure 5, the imported unit values are higher. Perhaps the fish being exported is of too low a quality to have a local market, or maybe it isn’t a fish that Californians like to eat. It may be that the imported fish has characteristics that local groundfish don’t have. But just what these characteristics are that are deciding values are largely unknown.

Figure 7 Unit value ($/mt) comparisons of foreign imports and foreign exports of groundfish from California

Fig5

Why are prices flat and why aren’t more groundfish being caught?

The data we have indicates there should be a large enough market within California to absorb all landings and that prices at the dock seem to be flat or declining in real dollars at some California ports. We also know that the quota for many species is not being used, i.e., the scientifically-informed regulations allow harvesters to catch more fish, but they are not. Altogether, this data indicates a disconnect or a mismatch between the end market and harvester level—if there is indeed market demand for groundfish, it is not extending to the harvesters in the form of better prices. If it were, we would expect to see all of the quota being used.

Questions: Why is this? Are the species they land not marketable? Is the quality not good enough? Is the catch volume not steady enough? And if catch volume isn’t steady enough, what level does it need to be and would freezing be a way to overcome this hurdle?

[1] Malden C. Nesheim, Ann L. Yaktine, and Institute of Medicine (U.S.), eds., Seafood Choices: Balancing Benefits and Risks (Washington, D.C: National Academies Press, 2007).
[2] “US Seafood Market Segmentation Study: An Assessment of Relative Purchasing Power and Risks in the U.S. Fish and Seafood Marketplace,” December 1, 2015.

Markets for Groundfish in California, Part 2 of 4

This is part 2 of a 4-part series intended to invite conversations in advance of our planned end market demand analysis for groundfish in California. The larger goal is to provide quantified end market data to inform profitable value chain investments that will positively impact harvesters, local communities and the ocean.

Export markets

How much California groundfish is exported and how much stays?

Fig1[1][2]

Although we have data from NMFS for exports from California ports, it’s not an apple-to-apples comparison to NMFS landings data, making it difficult to understand how much fish likely stays in California and how much fish exported from California actually was caught in California. The export data doesn’t divide export volumes and values by species, like the landings data does, but instead lumps it into broad categories for most species. For example, Dover sole and petrale sole, which are each reported in California landings, are lumped in the export category “flatfish”. This makes it hard to characterize demand for groundfish by end market preferences—we don’t know how much Dover stays in California or in the U.S., and how much is exported.

Another comparison conundrum is that the exports from California ports appear to include fish landed outside California waters. We did not include exports of pollock, haddock and cod since these are not recorded in the California landings data for the time period we compared. After filtering these out, there are relatively small volumes of groundfish (8-19%) exported as compared to landings in Figure 1.

Are there more money-makers like sablefish?

One bright point, in terms of value to the groundfish fishery, is sablefish. Sablefish seems to be driving not only value but volumes of exports from California. The average unit value (simply the landings value divided by the volume) for sablefish landings in California were usually twice as much as other groundfish from 2008 to 2014.For the same time period, the ratio of sablefish landed to sablefish exported averaged 24%, compared to 1 to 10% for most groundfish. Of course, this isn’t a wholly accurate comparison: since the sablefish exported from California may not have been landed there.

More than 90% of all exported sablefish over the time period assessed go to Japan, most of the sablefish going to Japan is frozen. Sablefish is doubly interesting because of this—not only are high value exports a rarity in this fishery, but so are high value frozen products.

Remaining questions include: Are there other species that can capitalize on the export market to Japan? Are there other species or markets that would have similar characteristics—a high value fish, exported in frozen form—where this success could be replicated?

Why does it seem that extremely low value groundfish is being exported?

Fig2

Another interesting comparison is the unit values of landings and exports in California, based on the same data provided by NMFS. We expect that export unit values would be higher than landing unit values, since they are likely processed and value-added. But for groundfish other than flatfish and sablefish, this expectation isn’t met. From 2008 through 2011, groundfish other than flatfish and sablefish had a higher unit value for landings than for exports.

There are a number of potential causes for this disparity:

  • We’re comparing different species. The “other groundfish” category that’s being exported is comprised of different species than the ones in the landings data. Perhaps these are low value species landed outside California and brought to California and exported.
  • Groundfish exports are lumped into a category other than “groundfish” for these years. Perhaps they’ve been exported in a product form that does not identify the type of fish.
  • Low value groundfish can’t be sold domestically. The groundfish being exported doesn’t match the domestic market demands and so the only market is a very low paying international market. Figure 3 compares the top five destinations for California groundfish.(Note that the Netherlands (NLD) appears to accept many low value imports in 2014.) Other than Japan, potential high value markets to explore include Vietnam and Canada. However, both these countries imported small amounts, albeit at high value, in 2014.

Fig3

[1] NMFS, “Commercial Landings,” page, Commercial Fishery Statistics, (2015), http://www.st.nmfs.noaa.gov/commercial-fisheries/commercial-landings/index
[2] NMFS, “Trade by Country,” page, Commercial Fishery Statistics, accessed February 18, 2015, http://www.st.nmfs.noaa.gov/commercial-fisheries/foreign-trade/applications/trade-by-country