Markets for Groundfish in California, Part 4 of 4

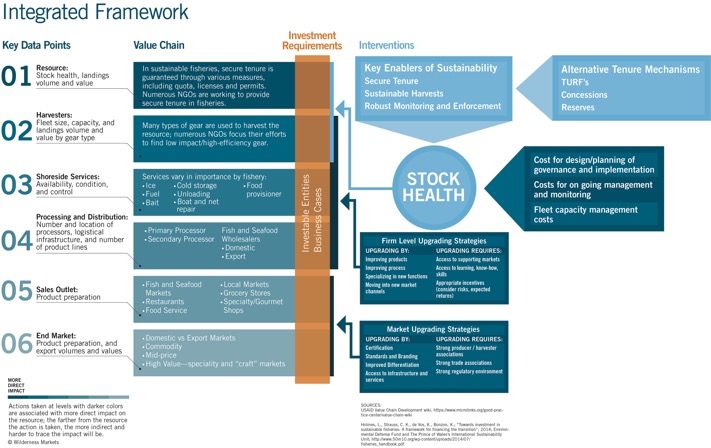
This is part 4 of a 4-part series intended to invite conversations in advance of our planned end market demand analysis for groundfish in California. The larger goal is to provide quantified end market data to inform profitable value chain investments that will positively impact harvesters, local communities and the ocean.

Waste and discards

The opaquest parts of the value chain are the discard and waste streams; we don’t have volume figures to distinguish between discards and processing trimmings and how much of each goes to secondary processors or to landfills. We believe this to be important given the high level of biomass discarded – in some cases as much as 70% of the landed fish (e.g. Dover sole, which has one of the higher quotas).

We identified one secondary processor and were told that disposing of processing byproducts is not a moneymaker; indeed, disposing of trimmings is a cost for processors which may be passed to harvesters. Just how much of a cost is unknown. Also unknown is what proportion is sent to the secondary processor and how much may be destined for landfill. In addition, we don’t know what volume of fish or fish waste enter this stream since the final end-market forms for domestic consumption is unknown (and thus how much fish is processed or sold whole is unknown).

A potential local solution to unvalued fishery byproducts was initiated in Morro Bay in which local farmers picked up bins of fish parts and turned them into soil amendment. However, discovery of state regulations that limit processing of the fish parts prohibited the continuation or expansion of the program.[1]

Questions: Would improving the value of discards and trimmings improve the value realized by harvesters? Is this a viable alternative market?

Final Thoughts

The West Coast Groundfish fishery could be a case study for successful fisheries management for hundreds of other fisheries around the world if it weren’t for the fact that so many harvesters still seem to be struggling economically. Until the harvesters are profitable enough to cover management costs, the most important part of the puzzle isn’t in place. Figuring out where the different pieces fit—value drivers, product flows and the like—will be a boon not only to these harvesters and their communities, but also to parties interested in investing in this, and other, fisheries.

[1] Kathy Johnston, “Hook, Line, and Sinker,” New Times, December 7, 2011, Volume 26, Issue 19 edition, http://www.newtimesslo.com/news/7042/hook-line-and-sinker/.

Sustainable Fisheries Finance – An Integrated Value Chain Approach (Part 1)

As our need for the oceans to provide us with food and livelihoods increases, the sustainability of fisheries becomes increasingly vital. One of the key components of fisheries value chain sustainability is the long-term economic sustainability of the fishermen. Without proper conditions to allow organizations to innovate and scale, economic, ecological and social returns are even more difficult to realize.

Wilderness Markets, with the support of the David and Lucile Packard Foundation and the Gordon and Betty Moore Foundation, undertook a series of fishery value chain assessments to better understand the opportunities and constraints for private impact capital to flow into wild capture fisheries markets

Over the course of 220 interviews, we assessed four developing country fisheries (DCFs) in two countries and one fishery in the U.S. Each fishery we assessed provided a piece of a larger puzzle, allowing us to identify the components of a sustainable seafood value chain and its relationship to stock health, which in turn, drives value chain health. We present this value chain as an “Integrated Framework” below.

A number of lessons may be taken from this framework:

  • Stock Health is positively impacted by the “Key Enablers of Sustainability”, but not by value chain interventions.
  • In reality, our findings indicate that in the absence of the Key Enablers, value chain dynamics, no matter how well intentioned, result in higher rates of stock depletion
  • Firm level and market level upgrading strategies are unlikely to result in stock health improvements in the absence of the Key Enablers
  • The majority of Developing Country Fisheries do not have any investable mechanism at the resource level in which to invest
  • The majority of Developing Country Artisanal Fisheries (as opposed to Industrial) are further challenged due to the lack of investable entities and legal recognition of fishers / harvesters, with Shoreside Service (03) providers as the first legally recognized entity in the value chain – not the harvesters (02).

We will explore what this means (including how Fisheries Improvement Plans or FIPs link into this) in a series of upcoming posts. We welcome your comments and inputs to this discussion.Wilderness Integrated Framework Feb 2016

Markets for Groundfish in California, Part 3 of 4

This is part 3 of a 4-part series intended to invite conversations in advance of our planned end market demand analysis for groundfish in California. The larger goal is to provide quantified end market data to inform profitable value chain investments that will positively impact harvesters, local communities and the ocean.

Can local demand be met with local fish AND will it increase prices paid to harvesters?

Determining the consumption of seafood products in California with any precision, much less the product characteristics or species composition, is difficult. Considering average per capita seafood consumption in the U.S. is 14.6 pounds per person and 2014 California population is an estimated 38.8 million people, expected seafood consumption in California is about 257,000 metric tons. This is about 38 times the groundfish landings in 2014.  

Estimates from 1993 through 2004 show that estimated consumption of flatfish, a subcategory of groundfish that includes fish like Dover and petrale sole, should be 5,300 metric tons in California. [1] Compare this to the 2,845 metric tons of flatfish landed in California in 2014 and you realize it’s far less than estimated consumption and even lower when processing is considered. Again, this indicates a substantial market that would be interested in purchasing groundfish.

Another strong indication comes from recent work by Changing Tastes.[2] “Whitefish” and “other” currently compose 20% and 15% of U.S. consumer purchases from all sources. Whitefish is a generic and nebulous category, but groundfish species should fall somewhere in either “Whitefish” or the “other” category. The math again indicates a substantial market–about 90,000 metric tons of “Whitefish” and “other” are expected to be consumed in California each year.

All the data indicate there should be a local market for California groundfish, at least based on estimated consumption volumes. However, the characteristics of demand are largely unknown, so we’re unsure whether this is true once product characteristics like flavor and texture are accounted for.

What affect are imported groundfish having on prices?

Despite the data indicating a fairly substantial market for seafood in California, prices in real dollars have remained flat or even declined at some California ports. If there were local market demand, we would expect to see prices at least hold steady, if not increase.

Figure 4 California price comparisons adjusted for inflation, sablefish, Dover and petrale sole, 2008-2014

Fig4

Figures 5 and 6 Price comparisons at major California groundfish trawl ports, adjusted for inflation, petrale and sablefish, 2008-2014

Price graphs

When the unit values of flatfish and other groundfish imported into California are compared to groundfish exported from California, as in Figure 5, the imported unit values are higher. Perhaps the fish being exported is of too low a quality to have a local market, or maybe it isn’t a fish that Californians like to eat. It may be that the imported fish has characteristics that local groundfish don’t have. But just what these characteristics are that are deciding values are largely unknown.

Figure 7 Unit value ($/mt) comparisons of foreign imports and foreign exports of groundfish from California

Fig5

Why are prices flat and why aren’t more groundfish being caught?

The data we have indicates there should be a large enough market within California to absorb all landings and that prices at the dock seem to be flat or declining in real dollars at some California ports. We also know that the quota for many species is not being used, i.e., the scientifically-informed regulations allow harvesters to catch more fish, but they are not. Altogether, this data indicates a disconnect or a mismatch between the end market and harvester level—if there is indeed market demand for groundfish, it is not extending to the harvesters in the form of better prices. If it were, we would expect to see all of the quota being used.

Questions: Why is this? Are the species they land not marketable? Is the quality not good enough? Is the catch volume not steady enough? And if catch volume isn’t steady enough, what level does it need to be and would freezing be a way to overcome this hurdle?

[1] Malden C. Nesheim, Ann L. Yaktine, and Institute of Medicine (U.S.), eds., Seafood Choices: Balancing Benefits and Risks (Washington, D.C: National Academies Press, 2007).
[2] “US Seafood Market Segmentation Study: An Assessment of Relative Purchasing Power and Risks in the U.S. Fish and Seafood Marketplace,” December 1, 2015.

Markets for Groundfish in California, Part 2 of 4

This is part 2 of a 4-part series intended to invite conversations in advance of our planned end market demand analysis for groundfish in California. The larger goal is to provide quantified end market data to inform profitable value chain investments that will positively impact harvesters, local communities and the ocean.

Export markets

How much California groundfish is exported and how much stays?

Fig1[1][2]

Although we have data from NMFS for exports from California ports, it’s not an apple-to-apples comparison to NMFS landings data, making it difficult to understand how much fish likely stays in California and how much fish exported from California actually was caught in California. The export data doesn’t divide export volumes and values by species, like the landings data does, but instead lumps it into broad categories for most species. For example, Dover sole and petrale sole, which are each reported in California landings, are lumped in the export category “flatfish”. This makes it hard to characterize demand for groundfish by end market preferences—we don’t know how much Dover stays in California or in the U.S., and how much is exported.

Another comparison conundrum is that the exports from California ports appear to include fish landed outside California waters. We did not include exports of pollock, haddock and cod since these are not recorded in the California landings data for the time period we compared. After filtering these out, there are relatively small volumes of groundfish (8-19%) exported as compared to landings in Figure 1.

Are there more money-makers like sablefish?

One bright point, in terms of value to the groundfish fishery, is sablefish. Sablefish seems to be driving not only value but volumes of exports from California. The average unit value (simply the landings value divided by the volume) for sablefish landings in California were usually twice as much as other groundfish from 2008 to 2014.For the same time period, the ratio of sablefish landed to sablefish exported averaged 24%, compared to 1 to 10% for most groundfish. Of course, this isn’t a wholly accurate comparison: since the sablefish exported from California may not have been landed there.

More than 90% of all exported sablefish over the time period assessed go to Japan, most of the sablefish going to Japan is frozen. Sablefish is doubly interesting because of this—not only are high value exports a rarity in this fishery, but so are high value frozen products.

Remaining questions include: Are there other species that can capitalize on the export market to Japan? Are there other species or markets that would have similar characteristics—a high value fish, exported in frozen form—where this success could be replicated?

Why does it seem that extremely low value groundfish is being exported?

Fig2

Another interesting comparison is the unit values of landings and exports in California, based on the same data provided by NMFS. We expect that export unit values would be higher than landing unit values, since they are likely processed and value-added. But for groundfish other than flatfish and sablefish, this expectation isn’t met. From 2008 through 2011, groundfish other than flatfish and sablefish had a higher unit value for landings than for exports.

There are a number of potential causes for this disparity:

  • We’re comparing different species. The “other groundfish” category that’s being exported is comprised of different species than the ones in the landings data. Perhaps these are low value species landed outside California and brought to California and exported.
  • Groundfish exports are lumped into a category other than “groundfish” for these years. Perhaps they’ve been exported in a product form that does not identify the type of fish.
  • Low value groundfish can’t be sold domestically. The groundfish being exported doesn’t match the domestic market demands and so the only market is a very low paying international market. Figure 3 compares the top five destinations for California groundfish.(Note that the Netherlands (NLD) appears to accept many low value imports in 2014.) Other than Japan, potential high value markets to explore include Vietnam and Canada. However, both these countries imported small amounts, albeit at high value, in 2014.

Fig3

[1] NMFS, “Commercial Landings,” page, Commercial Fishery Statistics, (2015), http://www.st.nmfs.noaa.gov/commercial-fisheries/commercial-landings/index
[2] NMFS, “Trade by Country,” page, Commercial Fishery Statistics, accessed February 18, 2015, http://www.st.nmfs.noaa.gov/commercial-fisheries/foreign-trade/applications/trade-by-country

Markets for Groundfish in California, Part 1 of 4

This is part 1 of a 4-part series intended to invite conversations in advance of our planned end market demand analysis for groundfish in California. The larger goal is to provide quantified end market data to inform profitable value chain investments that will positively impact harvesters, local communities and the ocean. Read more