Continuing our market demand assessment work with US West Coast Groundfish, our partner, Changing Tastes completed an assessment of key distribution channels to prepare for the survey they’ve just initiated. In this post, we discuss what the key distribution channels are, their preferences for fresh and frozen, and why any of that matters.
As we and others have said, the story of US West Coast Groundfish is one of best fish stories you probably haven’t heard. The fishery was declared an economic disaster in 2000, but in 2014 thirteen species were MSC certified in 2014, eight groundfish in the California Groundfish Collective fishery are green-rated by Seafood Watch plus more from the fishery that are green- or yellow-rated. In an effort to increase overall value in the fishery, we’re working with Changing Tastes to help determine who could be purchasing this fish and the key characteristics of demand.
Changing Tastes recently initiated a survey to assess demand, but they had to identify key market channels in order to focus assessment efforts. The following information is based on their work, which they completed using a combination of methods, including:
- Government data for whitefish consumption
- Publicly and privately held company data
- Professional opinion gained from working with some of the nation’s largest restaurant and food service companies and grocers
Total sales of whitefish (a broad category that would include the species landed in the fishery) are estimated at US $542.9 million in the three West Coast states based on US government data, with $442.7 million of that spent in California. Total dollar value of whitefish was second to shrimp, unsurprisingly.
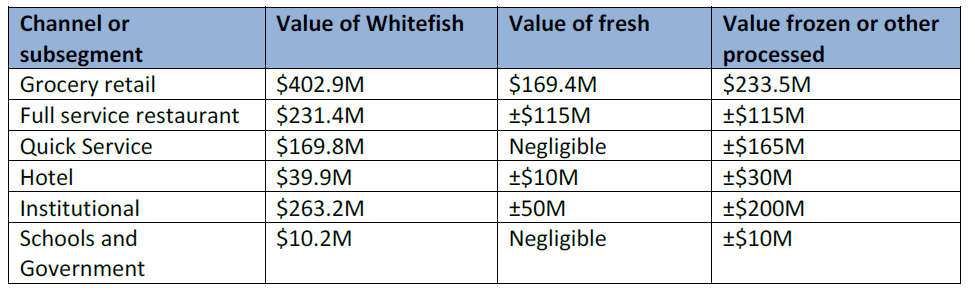
Sales and format value comparisons of whitefish in California, Oregon and Washington. Green is the proportion of the value sold fresh; blue is the proportion sold frozen. Size of the graph is relative to the total values of whitefish bought. (“School and government institutions” and “Hotels” are shown larger than their proportion of the total for visibility purposes. Grocery is actually ten times larger than hotel, and 40 times larger than schools and governments.)
These channel categories are generalizations—different companies and brands within each category may use different mixes of fresh and frozen—but the generalizations are useful for determining which channels to concentrate on for survey completion.
Interestingly, an unpublished May 2016 study by Globescan noted that California consumers are 20% more likely than the average national consumer to buy fish from fresh counters in grocery stores.

Changing Tastes then screened the channels using their professional opinion on parameters based on the desired outcome of improved values, including their ability of a market channel to:
- pay a premium for higher quality, local or sustainable
- use whole or minimally processed fish, frozen or fresh
- practice seasonality by varying menu options
- be flexible with species offered
Based on values, volumes and their professional opinion, Changing Tastes is prioritizing receiving feedback from the following channels, and the specialty distributors who supply them:
- grocery
- full service restaurants
- institutional foodservice sub-segment of colleges, corporate dining, and cultural and leisure destinations
- hotels
The survey started landing in inboxes last week. By mid-October, we should have more to report about the initial findings. Until then, if you have questions, comments or suggestions, we’d love to hear from you.