This is part 2 of a 4-part series intended to invite conversations in advance of our planned end market demand analysis for groundfish in California. The larger goal is to provide quantified end market data to inform profitable value chain investments that will positively impact harvesters, local communities and the ocean.
Export markets
How much California groundfish is exported and how much stays?
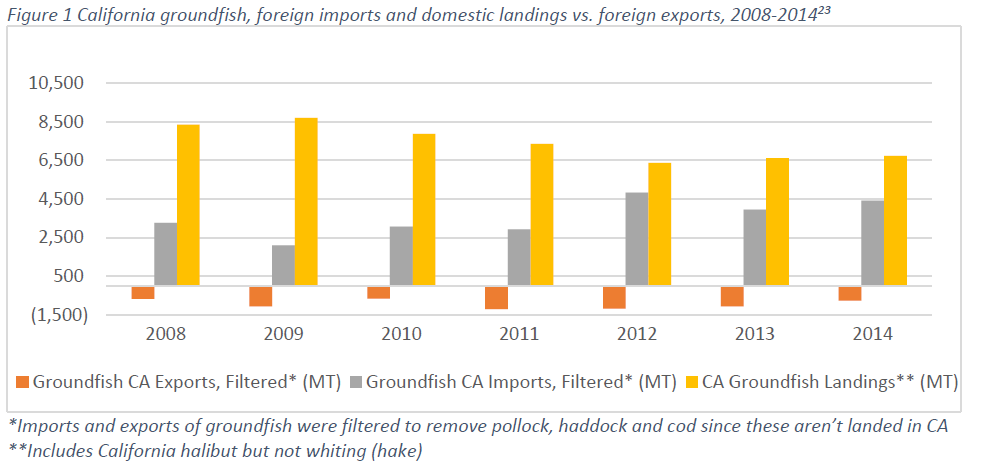
Although we have data from NMFS for exports from California ports, it’s not an apple-to-apples comparison to NMFS landings data, making it difficult to understand how much fish likely stays in California and how much fish exported from California actually was caught in California. The export data doesn’t divide export volumes and values by species, like the landings data does, but instead lumps it into broad categories for most species. For example, Dover sole and petrale sole, which are each reported in California landings, are lumped in the export category “flatfish”. This makes it hard to characterize demand for groundfish by end market preferences—we don’t know how much Dover stays in California or in the U.S., and how much is exported.
Another comparison conundrum is that the exports from California ports appear to include fish landed outside California waters. We did not include exports of pollock, haddock and cod since these are not recorded in the California landings data for the time period we compared. After filtering these out, there are relatively small volumes of groundfish (8-19%) exported as compared to landings in Figure 1.
Are there more money-makers like sablefish?
One bright point, in terms of value to the groundfish fishery, is sablefish. Sablefish seems to be driving not only value but volumes of exports from California. The average unit value (simply the landings value divided by the volume) for sablefish landings in California were usually twice as much as other groundfish from 2008 to 2014.For the same time period, the ratio of sablefish landed to sablefish exported averaged 24%, compared to 1 to 10% for most groundfish. Of course, this isn’t a wholly accurate comparison: since the sablefish exported from California may not have been landed there.
More than 90% of all exported sablefish over the time period assessed go to Japan, most of the sablefish going to Japan is frozen. Sablefish is doubly interesting because of this—not only are high value exports a rarity in this fishery, but so are high value frozen products.
Remaining questions include: Are there other species that can capitalize on the export market to Japan? Are there other species or markets that would have similar characteristics—a high value fish, exported in frozen form—where this success could be replicated?
Why does it seem that extremely low value groundfish is being exported?
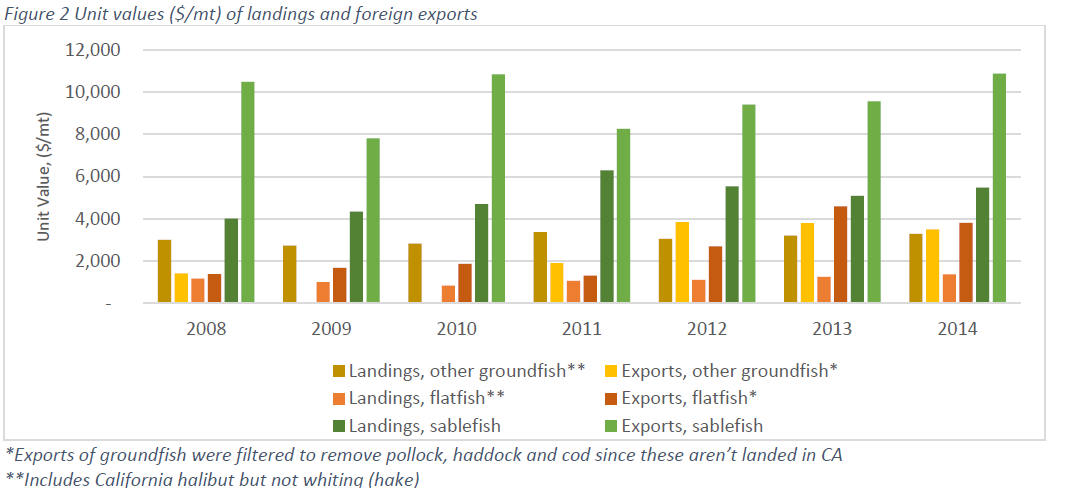
Another interesting comparison is the unit values of landings and exports in California, based on the same data provided by NMFS. We expect that export unit values would be higher than landing unit values, since they are likely processed and value-added. But for groundfish other than flatfish and sablefish, this expectation isn’t met. From 2008 through 2011, groundfish other than flatfish and sablefish had a higher unit value for landings than for exports.
There are a number of potential causes for this disparity:
- We’re comparing different species. The “other groundfish” category that’s being exported is comprised of different species than the ones in the landings data. Perhaps these are low value species landed outside California and brought to California and exported.
- Groundfish exports are lumped into a category other than “groundfish” for these years. Perhaps they’ve been exported in a product form that does not identify the type of fish.
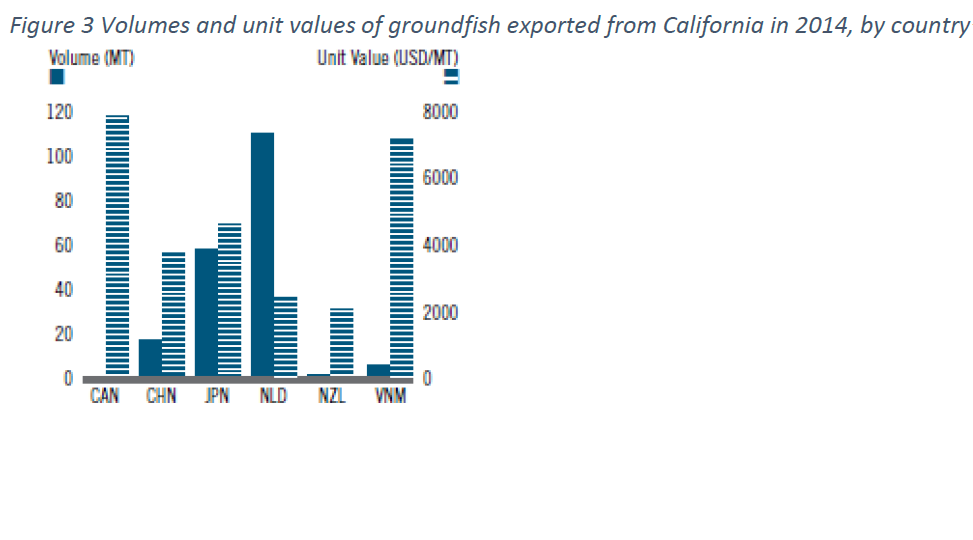
- Low value groundfish can’t be sold domestically. The groundfish being exported doesn’t match the domestic market demands and so the only market is a very low paying international market. Figure 3 compares the top five destinations for California groundfish.(Note that the Netherlands (NLD) appears to accept many low value imports in 2014.) Other than Japan, potential high value markets to explore include Vietnam and Canada. However, both these countries imported small amounts, albeit at high value, in 2014.
[1] NMFS, “Commercial Landings,” page, Commercial Fishery Statistics, (2015), http://www.st.nmfs.noaa.gov/commercial-fisheries/commercial-landings/index
[2] NMFS, “Trade by Country,” page, Commercial Fishery Statistics, accessed February 18, 2015, http://www.st.nmfs.noaa.gov/commercial-fisheries/foreign-trade/applications/trade-by-country