Posts

West Coast Groundfish Pilot: What’s Next for Developing Local Markets?

A previous post outlined the results of the recent market demand research for West Coast groundfish. This post follows-up with more detail on the proposed West Coast groundfish pilot.

Purpose and Intent

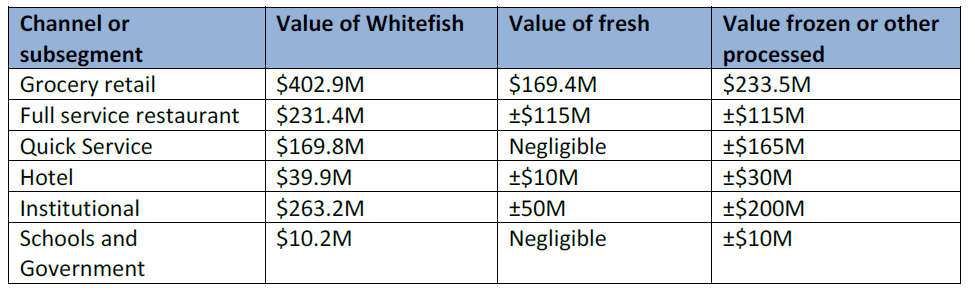
And now what? That was our first question after learning the results from the market demand research. Those results indicated that next efforts to improve demand and pricing for West Coast groundfish should focus on selling minimally processed products to suppliers and buyers in the grocery retail and full service restaurant sectors. The answer is a pilot project; one designed to test the findings which will help U.S. West Coast fishermen expand into regional market.

This project would aim to raise commercial buyers’ and suppliers’ awareness of U.S. West Coast Groundfish as a domestic, sustainable source of whitefish and prove that these fisheries can provide a reliable supply of local fish. As a result, it will establish new markets and demonstrate the benefits and availability of West Coast groundfish to other buyers and suppliers.

Rationale

A pilot project, with defined sales periods and goals, will provide room to experiment to build relationships and to understand the market dynamics. Without a pilot, it will be difficult, if not impossible, to rally collaborative action or justify further investments in the fishery. Harvesters and buyers envision a pilot as being a first step in creating an ongoing sales effort that expands beyond the West Coast within two to three years, possibly sooner.

A successful pilot is key to having larger, sophisticated customers purchase significant quantities for a substantial part of their operations; the pilot also develops the tools they need to successfully use and continue purchasing the fish. Assuming the pilot results in positive values, harvesters, trusts, buyers, NGO’s, and potential investors will have information necessary to make decisions about infrastructure, marketing and other investments. In addition, they can start sizing-up plans in the local, regional and national markets, all of which are important to increasing quota attainment.

Framework

To create organizational capacity that endures beyond the period of the pilot, it needs to be structured carefully. The fishermen and the buyers need to feel comfortable with their roles and build knowledge useful for future efforts. Because of this, the pilot project will endeavor to work within the existing supply chain to build the ability of the harvest groups and processors to provide reliable supply. Memorandums of understanding and contracts for the pilot have to be written so all the parties involved understand their roles and feel comfortable with their responsibilities. Of utmost importance, the pilot design must incorporate a way for the value chain to continue the work after the pilot concludes.

Target Outcomes

Some specific questions the pilot should be designed to answer revolve around the conditions and requirements for supply and pricing. At the outset, stakeholders will need to address legal restrictions on collaboration. The pilot should also define the incentives or conditions needed to gain cooperation between the processors and the groundfish harvesters. Also, the pilot should delineate the amount of fish, prices, and timing (flow of supply and seasons). Finally, the pilot will try to determine the level of transparency needed to build trust so that value chain actors can work together as a team to create value.

Final Thoughts

Regardless of who carries out the work, a pilot is the best next step for the West Coast groundfish stakeholders. The ultimate goals are easy – improve profits for those paying for management – but the route has to be carefully plotted. Building trust and knowledge and demonstrating improved values are key. We can get there, but we have to keep the focus on the end goal of a sustainable fishery, which means ensuring profitability for the harvesters.

Regional Demand and Opportunities for West Coast Groundfish

Our latest project, West Coast Groundfish Regional Market Demand and Opportunities, explored the market demand for U.S. West Coast groundfish in Oregon, Washington, and California. This post is a brief summary of that work. For more, please check out the executive summary of the report.

Background

Faced with plummeting catch levels and fish populations near collapse, many fishing boats left the U.S. West Coast groundfish fishery in the 1990’s and 2000’s. Commercial seafood buyers on the West Coast then turned to other whitefish, including Asian tilapia and Alaskan pollock.

Today, under new management systems, U.S. West Coast groundfish populations have rebounded and are fished sustainably – more than 20 species now rate as a “green, best choice” or “yellow, good alternative” with the Seafood Watch program, and 13 have received Marine Stewardship Council certification. With this conservation success in hand, how does U.S. West Coast groundfish regain a competitive market position and ensure that the recovery story includes economic success for fishermen?

Several studies have looked at the production side of this question, outlining supply chain hurdles and infrastructure issues that keep fishermen from reaping higher prices. This study is the first to look at the demand side of the market: how much whitefish West Coast buyers purchase; what potential there is to sell sustainable, U.S. West Coast groundfish in these regional markets; and how fishermen can increase the price per pound that they receive for their fish.

Methodology

Through a combination of market analyses, buyer surveys, industry interviews, and expert review, Changing Tastes and Wilderness Markets examined the current demand for West Coast groundfish in Washington, Oregon, and California. We identified categories of commercial buyers (e.g., restaurants, retail grocery stores) and types of seafood products that hold the greatest potential to increase economic gain for fishermen. We also explored the key barriers that fishermen will need to overcome to sell more product in these markets.

Results

Our results shows that focusing on selling minimally processed products to grocery and full service restaurant sectors holds the greatest potential to improve sales and profits for U.S. West Coast groundfish fisheries. Consequently, the next logical step is to test these findings. To do so, and help U.S. West Coast fishermen expand into regional markets, we recommend the development and launch of a pilot project. This project would aim to raise commercial buyers’ and suppliers’ awareness of U.S. West Coast groundfish as a domestic, sustainable source of whitefish and prove that these fisheries can provide a reliable supply of local fish to West Coast markets. If successful, it will establish new markets and demonstrate the benefits and availability of West Coast groundfish to buyers and suppliers.

We welcome your feedback on the market report and pilot concept. We hope that this research will stimulate additional conversations and partnerships that can help the U.S. West Coast groundfish fishery become a model of both ecological and economic success.

Prepared with support from:
The David and Lucile Packard Foundation and The Gordon and Betty Moore Foundation

For more of our work with U.S. West Coast Groundfish, please see our previous report, “West Coast Groundfish in California Value Chain Assessment.” 

What does stock health tell us about potential investments?

What’s an easy way for an investor to tell if a natural resource-based enterprise is going to be viable in three to five years? Part of that answer lies in evaluating the business and the regulatory environments in which it operates, but for natural resources in particular, the resource base trend needs to be examined; is it predicted that there will be more or less in the future, based on current extraction rates and scientific estimates of the resource level? And for conservation-focused impact investments, how can investors ensure they are not using more than the ecosystem can sustain?

In wild-capture fisheries, this translates to: “Will there be more or less of the fish to harvest in the future? Will my investment exacerbate overfishing?” Less fish to harvest means the effort level, and thus costs, will need to increase to find the remaining fish.

We’ve recently been puzzling through the easiest way for banks and impact investors to gauge the investability of fisheries enterprises, with a focus on Indonesia. Indonesia hosts some of the most biodiverse ocean ecosystems on our planet and is the world’s second largest harvester of wild capture fish. Banks and investors need quick, easily understood data that doesn’t unnecessarily burden their due diligence process but ensures they aren’t contributing to overfishing.

One tool that is already available in many fisheries is the stock assessment status, usually indicated as under- or moderately exploited, fully exploited, or over-exploited. The exploitation levels reflect scientific data on whether the fish in a fishery (the stock) are being sustainably harvested. Fully exploited indicates a stock that is thought to be fished and reproducing at nearly equal rates, i.e., the amount of fish harvested is the same as the fish being hatched and surviving to maturity. Over-exploited means harvest rates are too high, and under-exploited means they could increase rates without having a harmful effect on stocks.

Indonesia’s Ministry of Marine Affairs and Fisheries recently released the results of the National Commission on Stock Assessments (NOMOR 47/KEPMEN-KP/2016 TENTANG). The assessment provides an updated snapshot of ministry data in each fishery management area for the status of nine Indonesian fishery stocks.

Indonesia Stock Status

In addition to focusing government investments on improving the fishery health, we think the data can be useful for banks and investors. The assessment data can help investors quickly determine the potential health of the resource an enterprise relies on, helping to ensure they are not causing more fish to be used than can be replaced. The key to balancing conservation and investment entails finding new opportunities to do more, without using more.

Map of Indonesian Fishery Management Areas (WPP)

Disclaimer

The findings and conclusions in this report represent the interpretations of Wilderness Markets and do not necessarily reflect the view of expert stakeholders. This publication has been prepared solely for informational purposes, and has been prepared in good faith on the basis of information available at the date of publication without any independent verification. Wilderness Markets does not guarantee or warrant the accuracy, reliability, adequacy, completeness or currency of the information in this publication nor its usefulness in achieving any purpose. Charts and graphs provided herein are for illustrative purposes only. Nothing contained herein constitutes investment, legal, tax, or other advice nor is it to be relied on in making an investment or other decision. Readers are responsible for assessing the relevance and accuracy of the content of this publication. this publication should not be viewed as a current or past recommendation or a solicitation of an offer to buy or sell securities or to adopt any investment strategy.

US West Coast Groundfish – Key Market Channels

Continuing our market demand assessment work with US West Coast Groundfish, our partner, Changing Tastes completed an assessment of key distribution channels to prepare for the survey they’ve just initiated. In this post, we discuss what the key distribution channels are, their preferences for fresh and frozen, and why any of that matters.

As we and others have said, the story of US West Coast Groundfish is one of best fish stories you probably haven’t heard. The fishery was declared an economic disaster in 2000, but in 2014 thirteen species were MSC certified in 2014, eight groundfish in the California Groundfish Collective fishery are green-rated by Seafood Watch plus more from the fishery that are green- or yellow-rated. In an effort to increase overall value in the fishery, we’re working with Changing Tastes to help determine who could be purchasing this fish and the key characteristics of demand.

Changing Tastes recently initiated a survey to assess demand, but they had to identify key market channels in order to focus assessment efforts. The following information is based on their work, which they completed using a combination of methods, including:

  • Government data for whitefish consumption
  • Publicly and privately held company data
  • Professional opinion gained from working with some of the nation’s largest restaurant and food service companies and grocers

Total sales of whitefish (a broad category that would include the species landed in the fishery) are estimated at US $542.9 million in the three West Coast states based on US government data, with $442.7 million of that spent in California. Total dollar value of whitefish was second to shrimp, unsurprisingly.


Click to see table of approximate dollar values

Sales and format value comparisons of whitefish in California, Oregon and Washington. Green is the proportion of the value sold fresh; blue is the proportion sold frozen. Size of the graph is relative to the total values of whitefish bought. (“School and government institutions” and “Hotels” are shown larger than their proportion of the total for visibility purposes. Grocery is actually ten times larger than hotel, and 40 times larger than schools and governments.)

These channel categories are generalizations—different companies and brands within each category may use different mixes of fresh and frozen—but the generalizations are useful for determining which channels to concentrate on for survey completion.

Interestingly, an unpublished May 2016 study by Globescan noted that California consumers are 20% more likely than the average national consumer to buy fish from fresh counters in grocery stores.

Click to see table of approximate volumes

Click to see table of approximate volumes

Changing Tastes then screened the channels using their professional opinion on parameters based on the desired outcome of improved values, including their ability of a market channel to:

  • pay a premium for higher quality, local or sustainable
  • use whole or minimally processed fish, frozen or fresh
  • practice seasonality by varying menu options
  • be flexible with species offered

Based on values, volumes and their professional opinion, Changing Tastes is prioritizing receiving feedback from the following channels, and the specialty distributors who supply them:

  1. grocery
  2. full service restaurants
  3. institutional foodservice sub-segment of colleges, corporate dining, and cultural and leisure destinations
  4. hotels

The survey started landing in inboxes last week. By mid-October, we should have more to report about the initial findings. Until then, if you have questions, comments or suggestions, we’d love to hear from you.


Markets for Groundfish in California, Part 4 of 4

This is part 4 of a 4-part series intended to invite conversations in advance of our planned end market demand analysis for groundfish in California. The larger goal is to provide quantified end market data to inform profitable value chain investments that will positively impact harvesters, local communities and the ocean.

Waste and discards

The opaquest parts of the value chain are the discard and waste streams; we don’t have volume figures to distinguish between discards and processing trimmings and how much of each goes to secondary processors or to landfills. We believe this to be important given the high level of biomass discarded – in some cases as much as 70% of the landed fish (e.g. Dover sole, which has one of the higher quotas).

We identified one secondary processor and were told that disposing of processing byproducts is not a moneymaker; indeed, disposing of trimmings is a cost for processors which may be passed to harvesters. Just how much of a cost is unknown. Also unknown is what proportion is sent to the secondary processor and how much may be destined for landfill. In addition, we don’t know what volume of fish or fish waste enter this stream since the final end-market forms for domestic consumption is unknown (and thus how much fish is processed or sold whole is unknown).

A potential local solution to unvalued fishery byproducts was initiated in Morro Bay in which local farmers picked up bins of fish parts and turned them into soil amendment. However, discovery of state regulations that limit processing of the fish parts prohibited the continuation or expansion of the program.[1]

Questions: Would improving the value of discards and trimmings improve the value realized by harvesters? Is this a viable alternative market?

Final Thoughts

The West Coast Groundfish fishery could be a case study for successful fisheries management for hundreds of other fisheries around the world if it weren’t for the fact that so many harvesters still seem to be struggling economically. Until the harvesters are profitable enough to cover management costs, the most important part of the puzzle isn’t in place. Figuring out where the different pieces fit—value drivers, product flows and the like—will be a boon not only to these harvesters and their communities, but also to parties interested in investing in this, and other, fisheries.

[1] Kathy Johnston, “Hook, Line, and Sinker,” New Times, December 7, 2011, Volume 26, Issue 19 edition, http://www.newtimesslo.com/news/7042/hook-line-and-sinker/.

Markets for Groundfish in California, Part 3 of 4

This is part 3 of a 4-part series intended to invite conversations in advance of our planned end market demand analysis for groundfish in California. The larger goal is to provide quantified end market data to inform profitable value chain investments that will positively impact harvesters, local communities and the ocean.

Can local demand be met with local fish AND will it increase prices paid to harvesters?

Determining the consumption of seafood products in California with any precision, much less the product characteristics or species composition, is difficult. Considering average per capita seafood consumption in the U.S. is 14.6 pounds per person and 2014 California population is an estimated 38.8 million people, expected seafood consumption in California is about 257,000 metric tons. This is about 38 times the groundfish landings in 2014.  

Estimates from 1993 through 2004 show that estimated consumption of flatfish, a subcategory of groundfish that includes fish like Dover and petrale sole, should be 5,300 metric tons in California. [1] Compare this to the 2,845 metric tons of flatfish landed in California in 2014 and you realize it’s far less than estimated consumption and even lower when processing is considered. Again, this indicates a substantial market that would be interested in purchasing groundfish.

Another strong indication comes from recent work by Changing Tastes.[2] “Whitefish” and “other” currently compose 20% and 15% of U.S. consumer purchases from all sources. Whitefish is a generic and nebulous category, but groundfish species should fall somewhere in either “Whitefish” or the “other” category. The math again indicates a substantial market–about 90,000 metric tons of “Whitefish” and “other” are expected to be consumed in California each year.

All the data indicate there should be a local market for California groundfish, at least based on estimated consumption volumes. However, the characteristics of demand are largely unknown, so we’re unsure whether this is true once product characteristics like flavor and texture are accounted for.

What affect are imported groundfish having on prices?

Despite the data indicating a fairly substantial market for seafood in California, prices in real dollars have remained flat or even declined at some California ports. If there were local market demand, we would expect to see prices at least hold steady, if not increase.

Figure 4 California price comparisons adjusted for inflation, sablefish, Dover and petrale sole, 2008-2014

Fig4

Figures 5 and 6 Price comparisons at major California groundfish trawl ports, adjusted for inflation, petrale and sablefish, 2008-2014

Price graphs

When the unit values of flatfish and other groundfish imported into California are compared to groundfish exported from California, as in Figure 5, the imported unit values are higher. Perhaps the fish being exported is of too low a quality to have a local market, or maybe it isn’t a fish that Californians like to eat. It may be that the imported fish has characteristics that local groundfish don’t have. But just what these characteristics are that are deciding values are largely unknown.

Figure 7 Unit value ($/mt) comparisons of foreign imports and foreign exports of groundfish from California

Fig5

Why are prices flat and why aren’t more groundfish being caught?

The data we have indicates there should be a large enough market within California to absorb all landings and that prices at the dock seem to be flat or declining in real dollars at some California ports. We also know that the quota for many species is not being used, i.e., the scientifically-informed regulations allow harvesters to catch more fish, but they are not. Altogether, this data indicates a disconnect or a mismatch between the end market and harvester level—if there is indeed market demand for groundfish, it is not extending to the harvesters in the form of better prices. If it were, we would expect to see all of the quota being used.

Questions: Why is this? Are the species they land not marketable? Is the quality not good enough? Is the catch volume not steady enough? And if catch volume isn’t steady enough, what level does it need to be and would freezing be a way to overcome this hurdle?

[1] Malden C. Nesheim, Ann L. Yaktine, and Institute of Medicine (U.S.), eds., Seafood Choices: Balancing Benefits and Risks (Washington, D.C: National Academies Press, 2007).
[2] “US Seafood Market Segmentation Study: An Assessment of Relative Purchasing Power and Risks in the U.S. Fish and Seafood Marketplace,” December 1, 2015.

Markets for Groundfish in California, Part 2 of 4

This is part 2 of a 4-part series intended to invite conversations in advance of our planned end market demand analysis for groundfish in California. The larger goal is to provide quantified end market data to inform profitable value chain investments that will positively impact harvesters, local communities and the ocean.

Export markets

How much California groundfish is exported and how much stays?

Fig1[1][2]

Although we have data from NMFS for exports from California ports, it’s not an apple-to-apples comparison to NMFS landings data, making it difficult to understand how much fish likely stays in California and how much fish exported from California actually was caught in California. The export data doesn’t divide export volumes and values by species, like the landings data does, but instead lumps it into broad categories for most species. For example, Dover sole and petrale sole, which are each reported in California landings, are lumped in the export category “flatfish”. This makes it hard to characterize demand for groundfish by end market preferences—we don’t know how much Dover stays in California or in the U.S., and how much is exported.

Another comparison conundrum is that the exports from California ports appear to include fish landed outside California waters. We did not include exports of pollock, haddock and cod since these are not recorded in the California landings data for the time period we compared. After filtering these out, there are relatively small volumes of groundfish (8-19%) exported as compared to landings in Figure 1.

Are there more money-makers like sablefish?

One bright point, in terms of value to the groundfish fishery, is sablefish. Sablefish seems to be driving not only value but volumes of exports from California. The average unit value (simply the landings value divided by the volume) for sablefish landings in California were usually twice as much as other groundfish from 2008 to 2014.For the same time period, the ratio of sablefish landed to sablefish exported averaged 24%, compared to 1 to 10% for most groundfish. Of course, this isn’t a wholly accurate comparison: since the sablefish exported from California may not have been landed there.

More than 90% of all exported sablefish over the time period assessed go to Japan, most of the sablefish going to Japan is frozen. Sablefish is doubly interesting because of this—not only are high value exports a rarity in this fishery, but so are high value frozen products.

Remaining questions include: Are there other species that can capitalize on the export market to Japan? Are there other species or markets that would have similar characteristics—a high value fish, exported in frozen form—where this success could be replicated?

Why does it seem that extremely low value groundfish is being exported?

Fig2

Another interesting comparison is the unit values of landings and exports in California, based on the same data provided by NMFS. We expect that export unit values would be higher than landing unit values, since they are likely processed and value-added. But for groundfish other than flatfish and sablefish, this expectation isn’t met. From 2008 through 2011, groundfish other than flatfish and sablefish had a higher unit value for landings than for exports.

There are a number of potential causes for this disparity:

  • We’re comparing different species. The “other groundfish” category that’s being exported is comprised of different species than the ones in the landings data. Perhaps these are low value species landed outside California and brought to California and exported.
  • Groundfish exports are lumped into a category other than “groundfish” for these years. Perhaps they’ve been exported in a product form that does not identify the type of fish.
  • Low value groundfish can’t be sold domestically. The groundfish being exported doesn’t match the domestic market demands and so the only market is a very low paying international market. Figure 3 compares the top five destinations for California groundfish.(Note that the Netherlands (NLD) appears to accept many low value imports in 2014.) Other than Japan, potential high value markets to explore include Vietnam and Canada. However, both these countries imported small amounts, albeit at high value, in 2014.

Fig3

[1] NMFS, “Commercial Landings,” page, Commercial Fishery Statistics, (2015), http://www.st.nmfs.noaa.gov/commercial-fisheries/commercial-landings/index
[2] NMFS, “Trade by Country,” page, Commercial Fishery Statistics, accessed February 18, 2015, http://www.st.nmfs.noaa.gov/commercial-fisheries/foreign-trade/applications/trade-by-country

Does certification lead to better prices for harvesters?

Indonesian boat at dockImpact and philanthropic investors have an interest in participating in sustainable fisheries to enable effective management, to generate market share and price premiums and to ensure that harvesters are rewarded for and incentivised by sustainable practices. What tools do we have to determine when sustainable fisheries products gain market share and trigger changes in seafood pricing? Certain certified and ecolabeled seafood products have price premiums in the market. Can certification serve as a sound metric for good investment decisions in sustainable seafood? Studies thus far have demonstrated varying price premiums in certified products. These include:

  • Marine Stewardship Council (MSC)-certified frozen processed Al aska Pollock products in London with a 14.2%. price premium;
  • MSC labeled salmon products in Glasgow, UK with price premiums in low-end retail chains but not in high-end chains;
  • MSC certified products in Australia generated 30-50% price premiums and;
  • MSC certified Haddock has a 10% price premium in Scotland for processors and wholesalers.

MSC products do not always guarantee price premiums nor do they ensure long-term sustainability and economic gains for the harvester. Noted benefits for harvesters include access to new markets and processing opportunities for value added products, but not a trickle back from price premiums. A price premium found on a product in a retail chain or region does not mean the premium is globally ubiquitous. MSC notes that harvesters or chain of custody operators seeking certification do so to achieve sustainability outcomes, to gain clout and to improve negotiating capacity with large institutions. The goal of certification, therefore, is not always to attain price premiums or increased market share.

In addition, MSC does not collect market data prior to certification and thus does not measure changes in price. Over 10% of wild-capture seafood products are certified by the MSC. There are over 15 ecolabels for certified wild-capture or aquaculture seafood products, all of which have different metrics for certification and none of which measure if higher income from increased market share and price premiums reach the harvester. While MSC and other certifications can generate price premiums and seem to open market access, they are not yet a proven smart investments for all sustainable fisheries.