This is part 3 of a 4-part series intended to invite conversations in advance of our planned end market demand analysis for groundfish in California. The larger goal is to provide quantified end market data to inform profitable value chain investments that will positively impact harvesters, local communities and the ocean.
Can local demand be met with local fish AND will it increase prices paid to harvesters?
Determining the consumption of seafood products in California with any precision, much less the product characteristics or species composition, is difficult. Considering average per capita seafood consumption in the U.S. is 14.6 pounds per person and 2014 California population is an estimated 38.8 million people, expected seafood consumption in California is about 257,000 metric tons. This is about 38 times the groundfish landings in 2014.
Estimates from 1993 through 2004 show that estimated consumption of flatfish, a subcategory of groundfish that includes fish like Dover and petrale sole, should be 5,300 metric tons in California. [1] Compare this to the 2,845 metric tons of flatfish landed in California in 2014 and you realize it’s far less than estimated consumption and even lower when processing is considered. Again, this indicates a substantial market that would be interested in purchasing groundfish.
Another strong indication comes from recent work by Changing Tastes.[2] “Whitefish” and “other” currently compose 20% and 15% of U.S. consumer purchases from all sources. Whitefish is a generic and nebulous category, but groundfish species should fall somewhere in either “Whitefish” or the “other” category. The math again indicates a substantial market–about 90,000 metric tons of “Whitefish” and “other” are expected to be consumed in California each year.
All the data indicate there should be a local market for California groundfish, at least based on estimated consumption volumes. However, the characteristics of demand are largely unknown, so we’re unsure whether this is true once product characteristics like flavor and texture are accounted for.
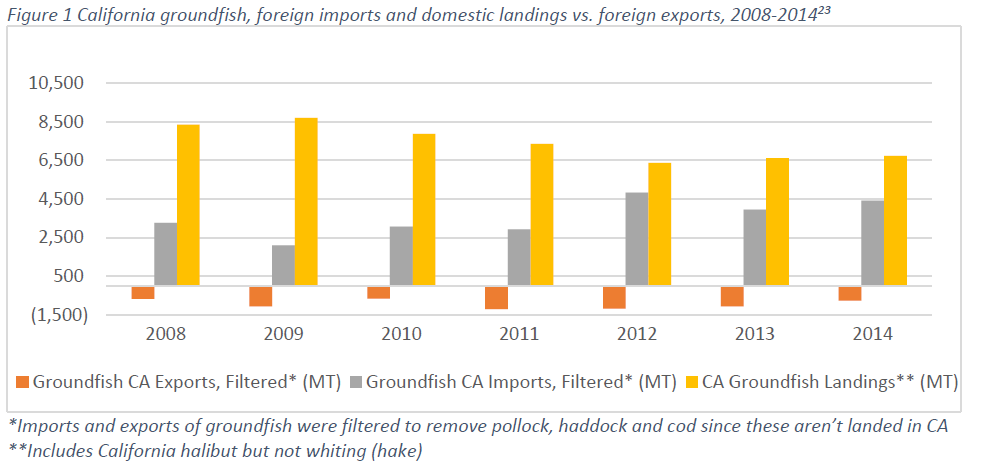
What affect are imported groundfish having on prices?
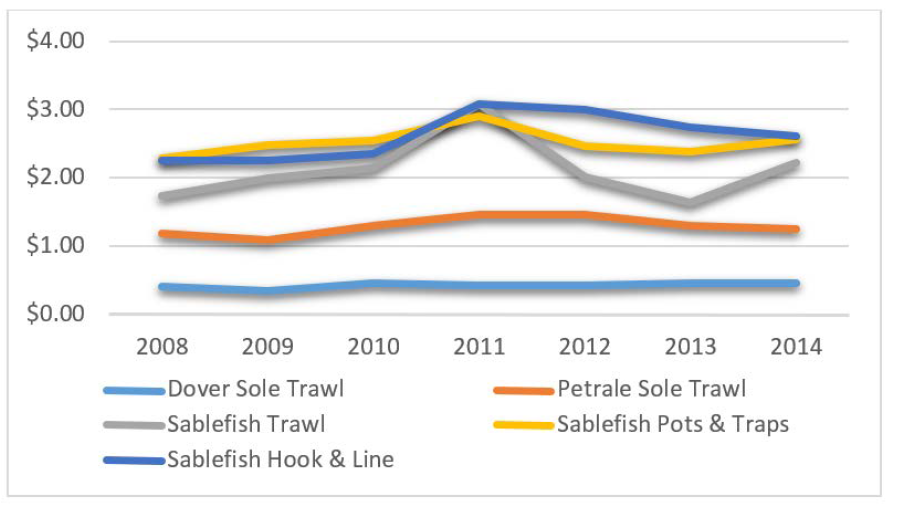
Despite the data indicating a fairly substantial market for seafood in California, prices in real dollars have remained flat or even declined at some California ports. If there were local market demand, we would expect to see prices at least hold steady, if not increase.
Figure 4 California price comparisons adjusted for inflation, sablefish, Dover and petrale sole, 2008-2014
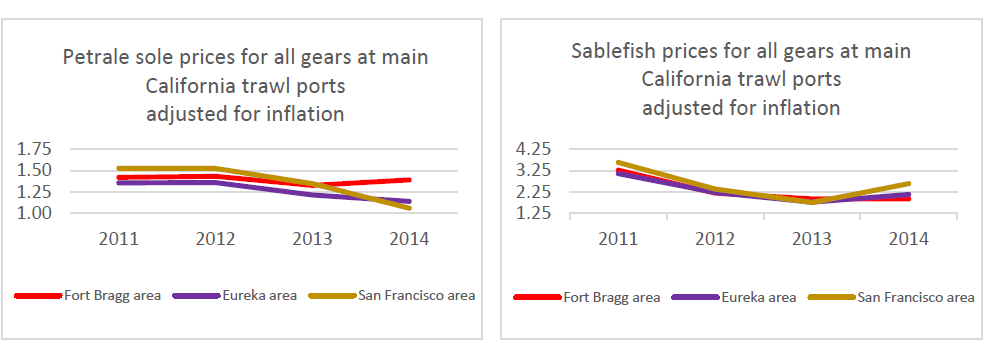
Figures 5 and 6 Price comparisons at major California groundfish trawl ports, adjusted for inflation, petrale and sablefish, 2008-2014
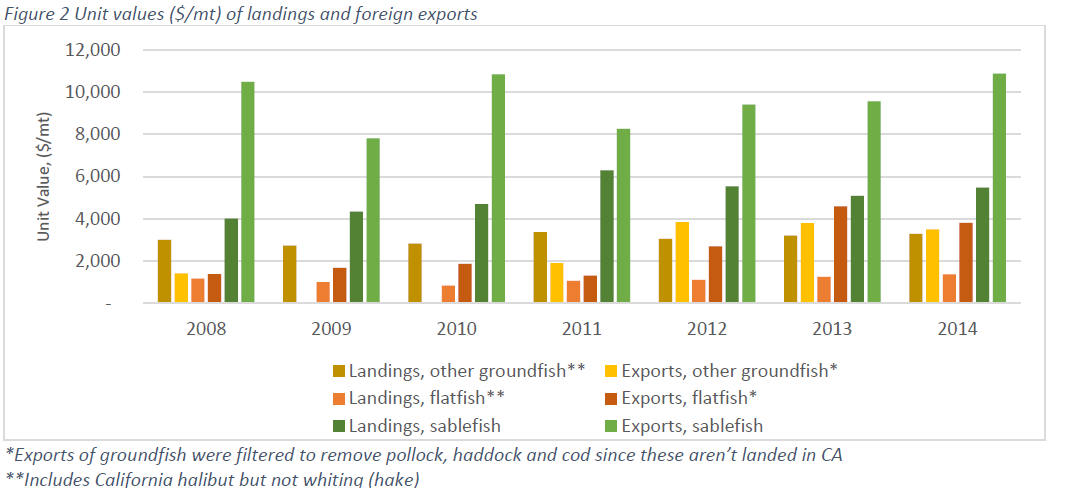
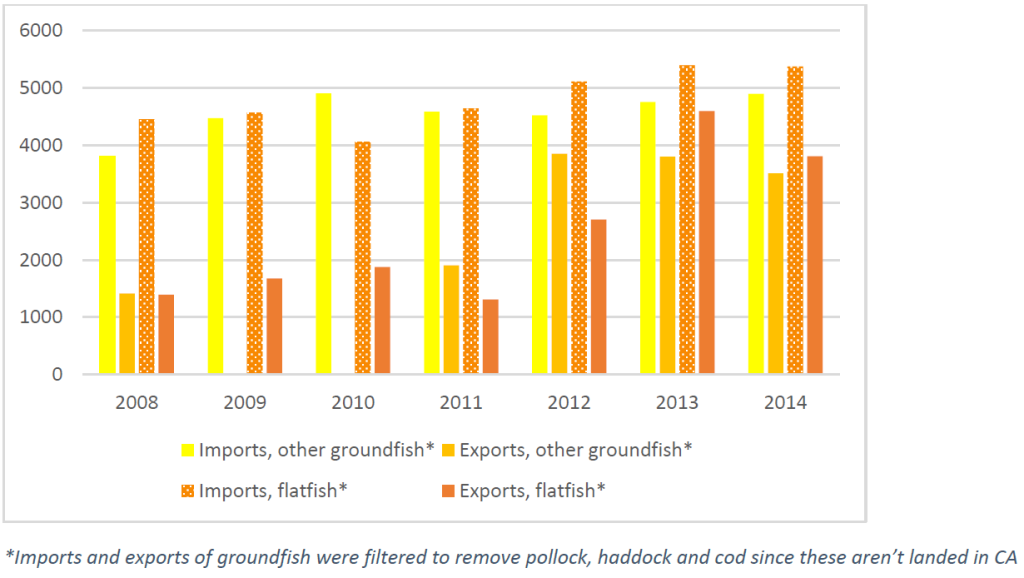
When the unit values of flatfish and other groundfish imported into California are compared to groundfish exported from California, as in Figure 5, the imported unit values are higher. Perhaps the fish being exported is of too low a quality to have a local market, or maybe it isn’t a fish that Californians like to eat. It may be that the imported fish has characteristics that local groundfish don’t have. But just what these characteristics are that are deciding values are largely unknown.
Figure 7 Unit value ($/mt) comparisons of foreign imports and foreign exports of groundfish from California
Why are prices flat and why aren’t more groundfish being caught?
The data we have indicates there should be a large enough market within California to absorb all landings and that prices at the dock seem to be flat or declining in real dollars at some California ports. We also know that the quota for many species is not being used, i.e., the scientifically-informed regulations allow harvesters to catch more fish, but they are not. Altogether, this data indicates a disconnect or a mismatch between the end market and harvester level—if there is indeed market demand for groundfish, it is not extending to the harvesters in the form of better prices. If it were, we would expect to see all of the quota being used.
Questions: Why is this? Are the species they land not marketable? Is the quality not good enough? Is the catch volume not steady enough? And if catch volume isn’t steady enough, what level does it need to be and would freezing be a way to overcome this hurdle?
[1] Malden C. Nesheim, Ann L. Yaktine, and Institute of Medicine (U.S.), eds., Seafood Choices: Balancing Benefits and Risks (Washington, D.C: National Academies Press, 2007).
[2] “US Seafood Market Segmentation Study: An Assessment of Relative Purchasing Power and Risks in the U.S. Fish and Seafood Marketplace,” December 1, 2015.