Posts

West Coast Pilot – Culinary Workshop

A previous post outlined our pilot project in California with Changing Tastes; this post provides a peek into a culinary workshop that is part of the planning phase.

Purpose

As part of our work to reintroduce local fish back into local markets in California, our foremost consideration is how to reintroduce them to our plates and palates. Without delicious dishes and high quality products, winning back a space on the plate will be impossible.

To discover how local fish can create a winning combination of flavor, presentation, and affordability for chefs in corporate dining, our partner Changing Tastes arranged a culinary workshop in California. More than a dozen chefs and several sustainability managers from the same or similar groups joined us in mid-November at a test kitchen in the Bay Area to develop the recipes and messaging needed to successfully bring back Californian West Coast Groundfish.

Palate and Pocket

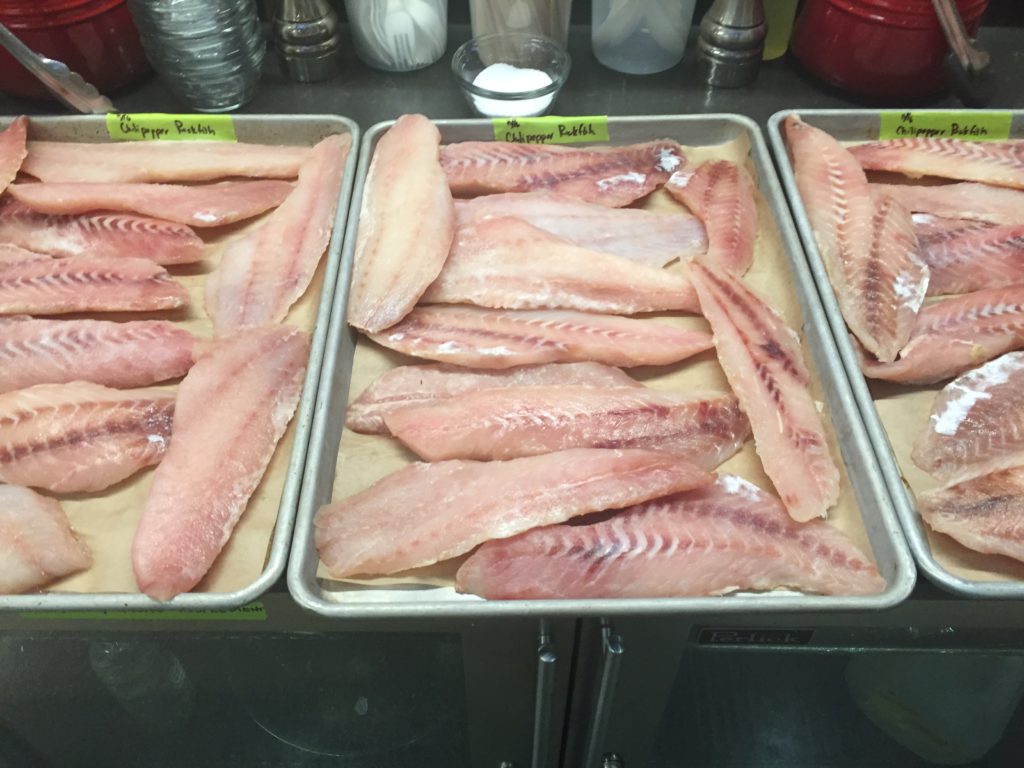
To explore which fish could please both palates and pocketbooks, the chefs spent the morning preparing a sampling of locally-caught fish, including Dover and petrale sole, boccaccio, chilipepper and black gill rockfish, and sablefish (AKA black cod) provided by Real Good Fish. These fish represent the spectrum of species that are part of the West Coast Groundfish program, one of the most sustainably managed fisheries in the world, and one that has the fish to prove the stocks are  healthy. These are fairly common landings that span from very inexpensive Dover to higher-end sablefish. The variety of textures, thicknesses and tastes were highlighted in Latin and Asian-inspired themes, such as black gill fish tacos with mango slaw (Chef Ochoa), petrale-coconut ceviche (Chef Fogata), black and white coconut crusted black cod (Chef Thomas), and steamed Szechuan boccaccio (Chef Hernaez).

Heart and Mind

Equally important to taste and cost is persuading diners to try these new dishes. In a nearby space, restaurant industry marketing and communications executives as well as sustainability managers and representatives of groups that support sustainable seafood brainstormed marketing ideas for the dining spaces where the fish will be offered to diners next spring.

Common themes included emphasizing that the fish is locally-caught in California. They noted that “local” often implies fresh to diners. Including a map of the different ports where the fish originates from for the pilot, and identifying fishermen and women from each was another popular theme.

Marketing experts, chefs, sustainability managers and others agree on not using the word “groundfish” in marketing materials. This group and others realize that this collective term for these species isn’t one that necessarily appeals to diners, nor does it help them understand the diversity of species and flavors within the broad category.

Pilot Evaluation

Among potential evaluation methods and data points, our participants identified these as the most likely:

  • On-site, established food focus groups
  • Measurement of orders by volume
  • Gauging the relationship between price of dishes and purchases
  • Comparison to sales of other seafood dishes
  • Comment cards
  • Online commenting system
  • Surveys, potentially with incentives, and/or provided in a quick format via touchpad at the point of purchase
  • Querying the culinary team during and after the pilot


Post-workshop steps

Our next tasks are confirming which specific dining halls and cafes will participate from each of the corporate dining partners and confirming likely order volume by species or species group, e.g., petrale sole is a species and rockfish is a species group. Almost simultaneously, we will work with the corporate dining partner and their existing distributors to determine the likely sources, feasible start dates, and volumes. We look forward to sharing updates as this work progresses in 2018.



West Coast Groundfish Pilot: What’s Next for Developing Local Markets?

A previous post outlined the results of the recent market demand research for West Coast groundfish. This post follows-up with more detail on the proposed West Coast groundfish pilot.

Purpose and Intent

And now what? That was our first question after learning the results from the market demand research. Those results indicated that next efforts to improve demand and pricing for West Coast groundfish should focus on selling minimally processed products to suppliers and buyers in the grocery retail and full service restaurant sectors. The answer is a pilot project; one designed to test the findings which will help U.S. West Coast fishermen expand into regional market.

This project would aim to raise commercial buyers’ and suppliers’ awareness of U.S. West Coast Groundfish as a domestic, sustainable source of whitefish and prove that these fisheries can provide a reliable supply of local fish. As a result, it will establish new markets and demonstrate the benefits and availability of West Coast groundfish to other buyers and suppliers.

Rationale

A pilot project, with defined sales periods and goals, will provide room to experiment to build relationships and to understand the market dynamics. Without a pilot, it will be difficult, if not impossible, to rally collaborative action or justify further investments in the fishery. Harvesters and buyers envision a pilot as being a first step in creating an ongoing sales effort that expands beyond the West Coast within two to three years, possibly sooner.

A successful pilot is key to having larger, sophisticated customers purchase significant quantities for a substantial part of their operations; the pilot also develops the tools they need to successfully use and continue purchasing the fish. Assuming the pilot results in positive values, harvesters, trusts, buyers, NGO’s, and potential investors will have information necessary to make decisions about infrastructure, marketing and other investments. In addition, they can start sizing-up plans in the local, regional and national markets, all of which are important to increasing quota attainment.

Framework

To create organizational capacity that endures beyond the period of the pilot, it needs to be structured carefully. The fishermen and the buyers need to feel comfortable with their roles and build knowledge useful for future efforts. Because of this, the pilot project will endeavor to work within the existing supply chain to build the ability of the harvest groups and processors to provide reliable supply. Memorandums of understanding and contracts for the pilot have to be written so all the parties involved understand their roles and feel comfortable with their responsibilities. Of utmost importance, the pilot design must incorporate a way for the value chain to continue the work after the pilot concludes.

Target Outcomes

Some specific questions the pilot should be designed to answer revolve around the conditions and requirements for supply and pricing. At the outset, stakeholders will need to address legal restrictions on collaboration. The pilot should also define the incentives or conditions needed to gain cooperation between the processors and the groundfish harvesters. Also, the pilot should delineate the amount of fish, prices, and timing (flow of supply and seasons). Finally, the pilot will try to determine the level of transparency needed to build trust so that value chain actors can work together as a team to create value.

Final Thoughts

Regardless of who carries out the work, a pilot is the best next step for the West Coast groundfish stakeholders. The ultimate goals are easy – improve profits for those paying for management – but the route has to be carefully plotted. Building trust and knowledge and demonstrating improved values are key. We can get there, but we have to keep the focus on the end goal of a sustainable fishery, which means ensuring profitability for the harvesters.

Regional Demand and Opportunities for West Coast Groundfish

Our latest project, West Coast Groundfish Regional Market Demand and Opportunities, explored the market demand for U.S. West Coast groundfish in Oregon, Washington, and California. This post is a brief summary of that work. For more, please check out the executive summary of the report.

Background

Faced with plummeting catch levels and fish populations near collapse, many fishing boats left the U.S. West Coast groundfish fishery in the 1990’s and 2000’s. Commercial seafood buyers on the West Coast then turned to other whitefish, including Asian tilapia and Alaskan pollock.

Today, under new management systems, U.S. West Coast groundfish populations have rebounded and are fished sustainably – more than 20 species now rate as a “green, best choice” or “yellow, good alternative” with the Seafood Watch program, and 13 have received Marine Stewardship Council certification. With this conservation success in hand, how does U.S. West Coast groundfish regain a competitive market position and ensure that the recovery story includes economic success for fishermen?

Several studies have looked at the production side of this question, outlining supply chain hurdles and infrastructure issues that keep fishermen from reaping higher prices. This study is the first to look at the demand side of the market: how much whitefish West Coast buyers purchase; what potential there is to sell sustainable, U.S. West Coast groundfish in these regional markets; and how fishermen can increase the price per pound that they receive for their fish.

Methodology

Through a combination of market analyses, buyer surveys, industry interviews, and expert review, Changing Tastes and Wilderness Markets examined the current demand for West Coast groundfish in Washington, Oregon, and California. We identified categories of commercial buyers (e.g., restaurants, retail grocery stores) and types of seafood products that hold the greatest potential to increase economic gain for fishermen. We also explored the key barriers that fishermen will need to overcome to sell more product in these markets.

Results

Our results shows that focusing on selling minimally processed products to grocery and full service restaurant sectors holds the greatest potential to improve sales and profits for U.S. West Coast groundfish fisheries. Consequently, the next logical step is to test these findings. To do so, and help U.S. West Coast fishermen expand into regional markets, we recommend the development and launch of a pilot project. This project would aim to raise commercial buyers’ and suppliers’ awareness of U.S. West Coast groundfish as a domestic, sustainable source of whitefish and prove that these fisheries can provide a reliable supply of local fish to West Coast markets. If successful, it will establish new markets and demonstrate the benefits and availability of West Coast groundfish to buyers and suppliers.

We welcome your feedback on the market report and pilot concept. We hope that this research will stimulate additional conversations and partnerships that can help the U.S. West Coast groundfish fishery become a model of both ecological and economic success.

Prepared with support from:
The David and Lucile Packard Foundation and The Gordon and Betty Moore Foundation

For more of our work with U.S. West Coast Groundfish, please see our previous report, “West Coast Groundfish in California Value Chain Assessment.” 

US West Coast Groundfish – Key Market Channels

Continuing our market demand assessment work with US West Coast Groundfish, our partner, Changing Tastes completed an assessment of key distribution channels to prepare for the survey they’ve just initiated. In this post, we discuss what the key distribution channels are, their preferences for fresh and frozen, and why any of that matters.

As we and others have said, the story of US West Coast Groundfish is one of best fish stories you probably haven’t heard. The fishery was declared an economic disaster in 2000, but in 2014 thirteen species were MSC certified in 2014, eight groundfish in the California Groundfish Collective fishery are green-rated by Seafood Watch plus more from the fishery that are green- or yellow-rated. In an effort to increase overall value in the fishery, we’re working with Changing Tastes to help determine who could be purchasing this fish and the key characteristics of demand.

Changing Tastes recently initiated a survey to assess demand, but they had to identify key market channels in order to focus assessment efforts. The following information is based on their work, which they completed using a combination of methods, including:

  • Government data for whitefish consumption
  • Publicly and privately held company data
  • Professional opinion gained from working with some of the nation’s largest restaurant and food service companies and grocers

Total sales of whitefish (a broad category that would include the species landed in the fishery) are estimated at US $542.9 million in the three West Coast states based on US government data, with $442.7 million of that spent in California. Total dollar value of whitefish was second to shrimp, unsurprisingly.


Click to see table of approximate dollar values

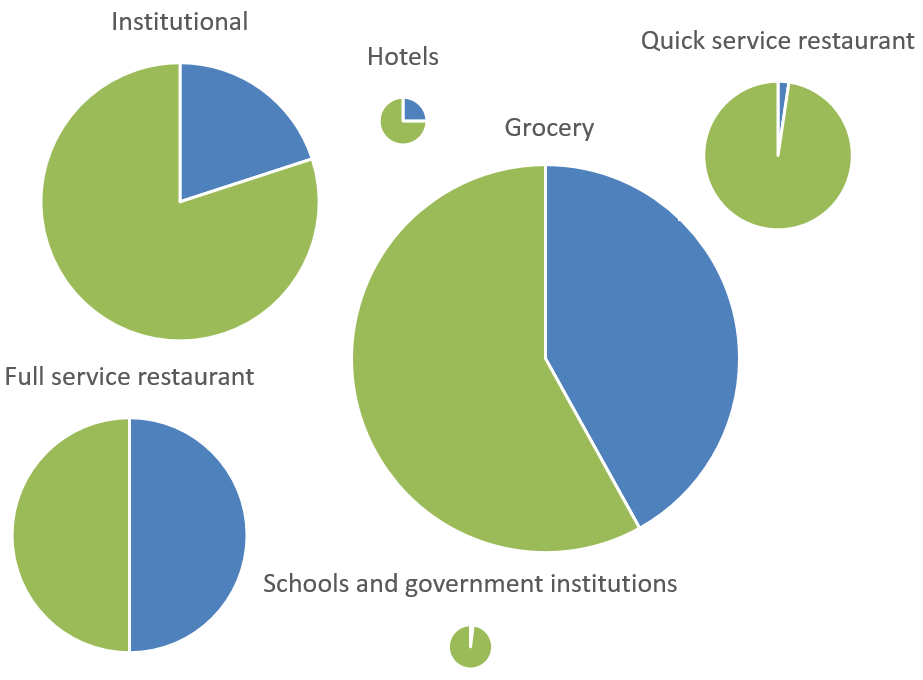
Sales and format value comparisons of whitefish in California, Oregon and Washington. Green is the proportion of the value sold fresh; blue is the proportion sold frozen. Size of the graph is relative to the total values of whitefish bought. (“School and government institutions” and “Hotels” are shown larger than their proportion of the total for visibility purposes. Grocery is actually ten times larger than hotel, and 40 times larger than schools and governments.)

These channel categories are generalizations—different companies and brands within each category may use different mixes of fresh and frozen—but the generalizations are useful for determining which channels to concentrate on for survey completion.

Interestingly, an unpublished May 2016 study by Globescan noted that California consumers are 20% more likely than the average national consumer to buy fish from fresh counters in grocery stores.

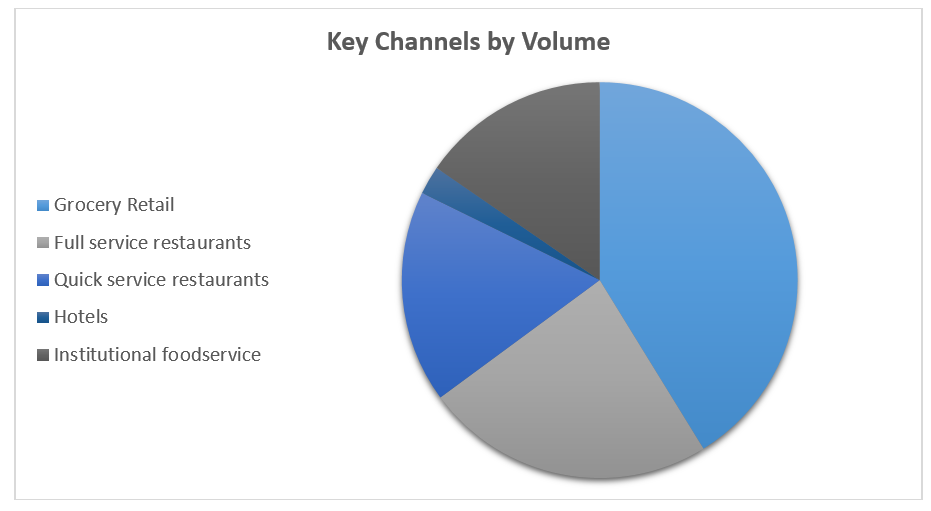
Click to see table of approximate volumes

Click to see table of approximate volumes

Changing Tastes then screened the channels using their professional opinion on parameters based on the desired outcome of improved values, including their ability of a market channel to:

  • pay a premium for higher quality, local or sustainable
  • use whole or minimally processed fish, frozen or fresh
  • practice seasonality by varying menu options
  • be flexible with species offered

Based on values, volumes and their professional opinion, Changing Tastes is prioritizing receiving feedback from the following channels, and the specialty distributors who supply them:

  1. grocery
  2. full service restaurants
  3. institutional foodservice sub-segment of colleges, corporate dining, and cultural and leisure destinations
  4. hotels

The survey started landing in inboxes last week. By mid-October, we should have more to report about the initial findings. Until then, if you have questions, comments or suggestions, we’d love to hear from you.


What lessons can be learned from the Icelandic cod value chain?

Iceland - Siglufirði Siglufjörður By Hansueli Krapf This file was uploaded with Commonist. [CC BY-SA 3.0 (http://creativecommons.org/licenses/by-sa/3.0)], via Wikimedia Commons

Iceland – Siglufirði Siglufjörður By Hansueli Krapf This file was uploaded with Commonist. [CC BY-SA 3.0 (http://creativecommons.org/licenses/by-sa/3.0)], via Wikimedia Commons

Icelandic cod first came to our attention at Wilderness Markets when we were collaborating with Future of Fish on research into financing needs in the US Northeast Multispecies Sector Program. How can cod from, Iceland, over 2000 miles away be not only cheaper but of equal or better quality than cod caught from just outside your proverbial front door?

A series of papers highlights important developments and key factors in the success of the Icelandic cod value chain since the ‘90s. The series include:

  1. The Effects of Fisheries Management on the Icelandic Demersal Fish Value Chain, 2016[1]
  2. A Comparison of the Icelandic Cod Value Chain and the Yellow Fin Tuna Value Chain of Sri Lanka, 2010[2]
  3. The Role of Fish Markets in the Icelandic Value Chain of Cod, 2010[3]
  4. The Importance of SMEs in the Icelandic Fisheries Global Value Chain, July 2009[4]
  5. Structural Changes in the Icelandic Fisheries Sector – A Value Chain Analysis, 2008[5]

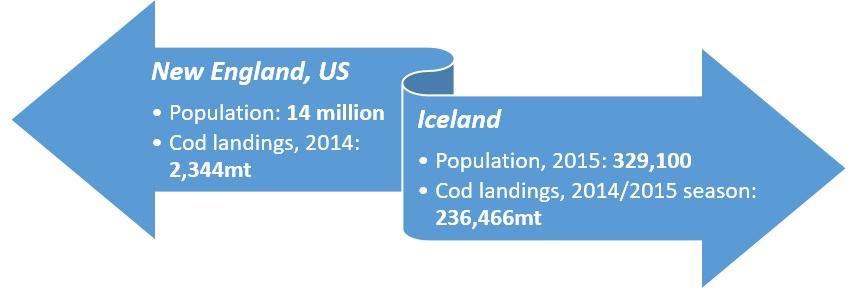
Before digging in too far, two aspects of the Icelandic versus the New England value chains can’t be overlooked—the relatively small population of Iceland and the relatively high landings of cod.  For disputed reasons (climate change, better management, etc.) Iceland has a much healthier, i.e. more abundant stock, and hundred-fold greater landings than New England. Along with much higher landings, a far lower population means a robust export market.

2016-06-23

[6]

Key factors and developments:

  • Increased efficiency at multiple levels of the value chain has helped improve value
  • Domestic value creation, specifically in the form of fresh fillets, has added significant value
  • Information flow (availability of information) and knowledge drive value
  • Use of marketing information to govern the value chain through vertical integrated companies and fish auction markets
  • Fish markets (auctions) improve efficiency and improve the consistency of supply for the value chain by acting as clearinghouses and support speculation
  • Consolidation of vessels, fishermen, processors, processing workers, and quota ownership have occurred in significant number
  • Increased specializations in fishing and processing

An interesting aspect that warranted a whole paper is the role of the fish markets, effectively online auctions, wherein all bidding is done through one computerized system owned by 15 independent markets since 2000. These private markets only handle 20% of the landings by volume but have a high value in terms of value chain efficiency because they allow for specialization (buyers can sell or swap species not needed for production), provide stability (buyers can ‘top-up’ if they are short on supply) and creates market-driven value for species. The rise in general groundfish prices by 20% from 1999 to 2008 is thought to be partially attributed to the fish market system.

Some key aspects of the Icelandic cod value chain, like low human population in Iceland and abundance of target species in their waters, don’t readily translate to Wilderness Markets’ recent focus on the Indonesian and U.S. West Coast fisheries. Others do. For instance, in the paper on the importance of small and medium enterprises (SMEs), the increase in vertically integrated companies means those companies have better control of the reliability, quality and delivery of fisheries products. Their competitive advantages are related to quality assurance knowledge, good logistics and dedicated export and sales management. On an almost reverse timeline for the U.S. West Coast groundfish fishery in California, fish handling in Iceland improved in the ‘90s and ‘00s by investments in better onboard cooling systems, shorter fishing trips and logistics improvements.

In the 2016 paper, they also describe the structure of the value chain before the export licensing system was abolished in the 1980s—importantly, and with implications for other value chains – the three large marketing and sales organizations that controlled most of the fish failed to send market signals back to producers. The new, vertically integrated companies that replaced these organizations heeded signals from foreign customers and improved product quality and successfully added value domestically by switching processing to Iceland instead of overseas.

We have witnessed this same disconnect in many other fisheries; fishermen don’t seem to have any idea about the needs and demands of the end markets and have no incentive to meet these demands. In one of the most telling statements in the series, an interviewee states, “They [the Norwegians] are still mostly thinking about catching while we have reached the point where we think about serving the market.” Most fishermen have not yet been able to reach this stage, hindering their ability to realize improved value for their work.

We’re hopeful that the end-market research currently underway in California will provide market data that can be turned into increased value for the harvesters working diligently to promote sustainability.

[1] Knútsson, Ö., Kristófersson, D. M., & Gestsson, H. (2016). The effects of fisheries management on the Icelandic demersal fish value chain. Marine Policy63, 172-179..

[2] Knútsson, Ö., Gestsson, H., Klemensson, O., Thordarson, G., & Amaralal, L. (2010). A Comparison of the Icelandic Cod Value Chain and the Yellow Fin Tuna Value Chain in Sri Lanka.

[3] Knútsson, Ö., Klemensson, Ó., & Gestsson, H. (2010). The Role of Fish-Markets in the Icelandic Value Chain of Cod.

[4] Knútsson, Ö., Gestsson, H., & Klemensson, Ó. (2009, July). The importance of SMEs in the Icelandic fisheries global value chain. In IXX EAFE Conference Proceedings (pp. 6-9).

[5] Knútsson, Ö., Klemensson, Ó., & Gestsson, H. (2008). Structural changes in the Icelandic fisheries sector-a value chain analysis.

[6] New England Population: http://www.dlt.ri.gov/lmi/census/pop/neweng.htm
Iceland Population: http://www.iceland.is/the-big-picture/quick-facts

US landings: http://www.st.nmfs.noaa.gov/commercial-fisheries/commercial-landings/annual-landings/index
Icelandic landings: http://icefishnews.com/wp-content/uploads/2013/05/Marko-partners-%C3%ADslenski-kv%C3%B3tinn.png


Groundfish Market Demand in California

We’re pleased to announce that Changing Tastes and Wilderness markets will be collaborating to carry out the market research for groundfish in California announced in our RFP. Having robust data about business and institutional buyers close to the consumer will address one of the key information gaps we identified in our value chain analysis; the ultimate goal of the work is to improve the economic value of products from this fishery. 

Read more

Markets for Groundfish in California, Part 4 of 4

This is part 4 of a 4-part series intended to invite conversations in advance of our planned end market demand analysis for groundfish in California. The larger goal is to provide quantified end market data to inform profitable value chain investments that will positively impact harvesters, local communities and the ocean.

Waste and discards

The opaquest parts of the value chain are the discard and waste streams; we don’t have volume figures to distinguish between discards and processing trimmings and how much of each goes to secondary processors or to landfills. We believe this to be important given the high level of biomass discarded – in some cases as much as 70% of the landed fish (e.g. Dover sole, which has one of the higher quotas).

We identified one secondary processor and were told that disposing of processing byproducts is not a moneymaker; indeed, disposing of trimmings is a cost for processors which may be passed to harvesters. Just how much of a cost is unknown. Also unknown is what proportion is sent to the secondary processor and how much may be destined for landfill. In addition, we don’t know what volume of fish or fish waste enter this stream since the final end-market forms for domestic consumption is unknown (and thus how much fish is processed or sold whole is unknown).

A potential local solution to unvalued fishery byproducts was initiated in Morro Bay in which local farmers picked up bins of fish parts and turned them into soil amendment. However, discovery of state regulations that limit processing of the fish parts prohibited the continuation or expansion of the program.[1]

Questions: Would improving the value of discards and trimmings improve the value realized by harvesters? Is this a viable alternative market?

Final Thoughts

The West Coast Groundfish fishery could be a case study for successful fisheries management for hundreds of other fisheries around the world if it weren’t for the fact that so many harvesters still seem to be struggling economically. Until the harvesters are profitable enough to cover management costs, the most important part of the puzzle isn’t in place. Figuring out where the different pieces fit—value drivers, product flows and the like—will be a boon not only to these harvesters and their communities, but also to parties interested in investing in this, and other, fisheries.

[1] Kathy Johnston, “Hook, Line, and Sinker,” New Times, December 7, 2011, Volume 26, Issue 19 edition, http://www.newtimesslo.com/news/7042/hook-line-and-sinker/.

Markets for Groundfish in California, Part 3 of 4

This is part 3 of a 4-part series intended to invite conversations in advance of our planned end market demand analysis for groundfish in California. The larger goal is to provide quantified end market data to inform profitable value chain investments that will positively impact harvesters, local communities and the ocean.

Can local demand be met with local fish AND will it increase prices paid to harvesters?

Determining the consumption of seafood products in California with any precision, much less the product characteristics or species composition, is difficult. Considering average per capita seafood consumption in the U.S. is 14.6 pounds per person and 2014 California population is an estimated 38.8 million people, expected seafood consumption in California is about 257,000 metric tons. This is about 38 times the groundfish landings in 2014.  

Estimates from 1993 through 2004 show that estimated consumption of flatfish, a subcategory of groundfish that includes fish like Dover and petrale sole, should be 5,300 metric tons in California. [1] Compare this to the 2,845 metric tons of flatfish landed in California in 2014 and you realize it’s far less than estimated consumption and even lower when processing is considered. Again, this indicates a substantial market that would be interested in purchasing groundfish.

Another strong indication comes from recent work by Changing Tastes.[2] “Whitefish” and “other” currently compose 20% and 15% of U.S. consumer purchases from all sources. Whitefish is a generic and nebulous category, but groundfish species should fall somewhere in either “Whitefish” or the “other” category. The math again indicates a substantial market–about 90,000 metric tons of “Whitefish” and “other” are expected to be consumed in California each year.

All the data indicate there should be a local market for California groundfish, at least based on estimated consumption volumes. However, the characteristics of demand are largely unknown, so we’re unsure whether this is true once product characteristics like flavor and texture are accounted for.

What affect are imported groundfish having on prices?

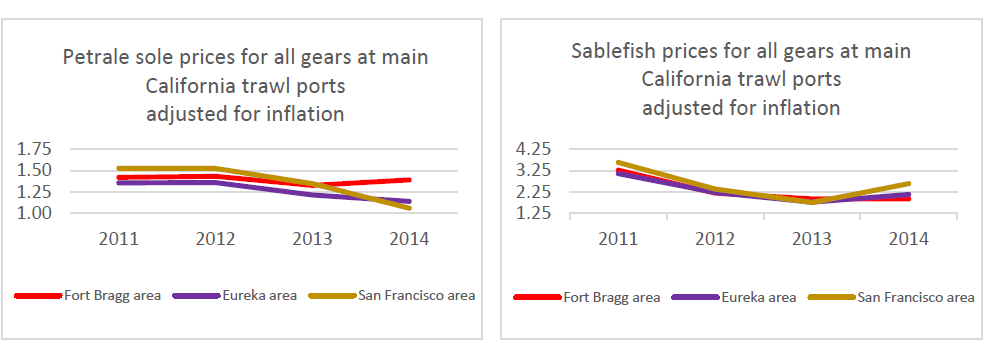
Despite the data indicating a fairly substantial market for seafood in California, prices in real dollars have remained flat or even declined at some California ports. If there were local market demand, we would expect to see prices at least hold steady, if not increase.

Figure 4 California price comparisons adjusted for inflation, sablefish, Dover and petrale sole, 2008-2014

Fig4

Figures 5 and 6 Price comparisons at major California groundfish trawl ports, adjusted for inflation, petrale and sablefish, 2008-2014

Price graphs

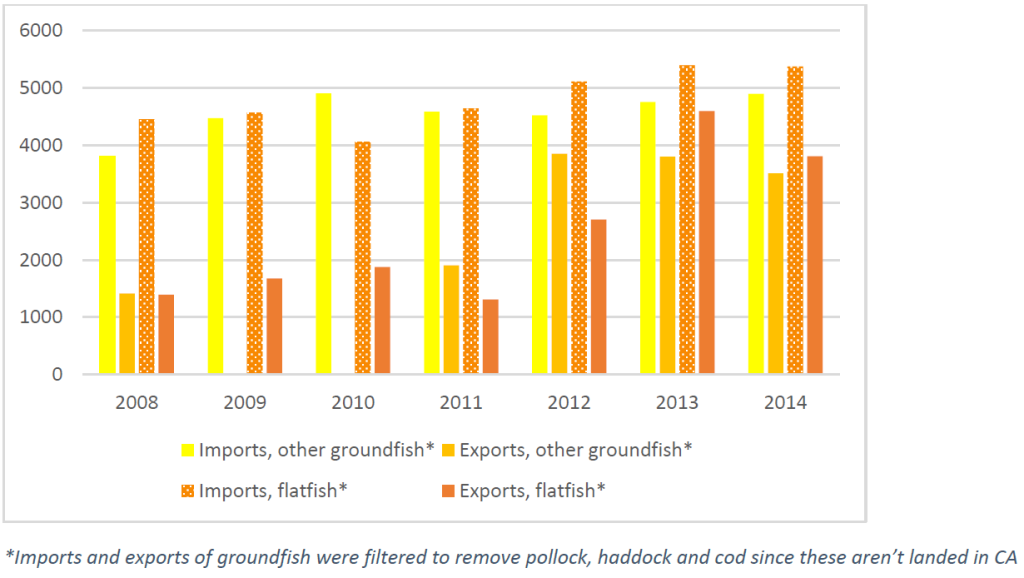
When the unit values of flatfish and other groundfish imported into California are compared to groundfish exported from California, as in Figure 5, the imported unit values are higher. Perhaps the fish being exported is of too low a quality to have a local market, or maybe it isn’t a fish that Californians like to eat. It may be that the imported fish has characteristics that local groundfish don’t have. But just what these characteristics are that are deciding values are largely unknown.

Figure 7 Unit value ($/mt) comparisons of foreign imports and foreign exports of groundfish from California

Fig5

Why are prices flat and why aren’t more groundfish being caught?

The data we have indicates there should be a large enough market within California to absorb all landings and that prices at the dock seem to be flat or declining in real dollars at some California ports. We also know that the quota for many species is not being used, i.e., the scientifically-informed regulations allow harvesters to catch more fish, but they are not. Altogether, this data indicates a disconnect or a mismatch between the end market and harvester level—if there is indeed market demand for groundfish, it is not extending to the harvesters in the form of better prices. If it were, we would expect to see all of the quota being used.

Questions: Why is this? Are the species they land not marketable? Is the quality not good enough? Is the catch volume not steady enough? And if catch volume isn’t steady enough, what level does it need to be and would freezing be a way to overcome this hurdle?

[1] Malden C. Nesheim, Ann L. Yaktine, and Institute of Medicine (U.S.), eds., Seafood Choices: Balancing Benefits and Risks (Washington, D.C: National Academies Press, 2007).
[2] “US Seafood Market Segmentation Study: An Assessment of Relative Purchasing Power and Risks in the U.S. Fish and Seafood Marketplace,” December 1, 2015.

Markets for Groundfish in California, Part 2 of 4

This is part 2 of a 4-part series intended to invite conversations in advance of our planned end market demand analysis for groundfish in California. The larger goal is to provide quantified end market data to inform profitable value chain investments that will positively impact harvesters, local communities and the ocean.

Export markets

How much California groundfish is exported and how much stays?

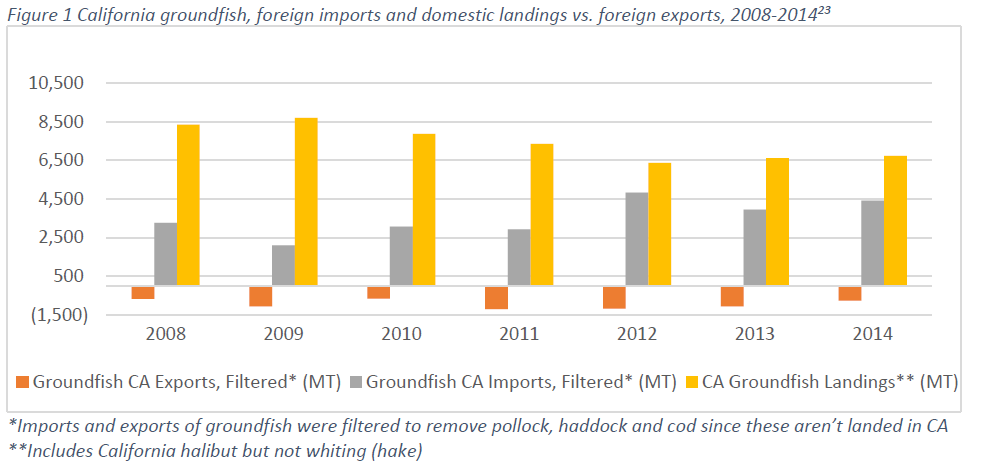
Fig1[1][2]

Although we have data from NMFS for exports from California ports, it’s not an apple-to-apples comparison to NMFS landings data, making it difficult to understand how much fish likely stays in California and how much fish exported from California actually was caught in California. The export data doesn’t divide export volumes and values by species, like the landings data does, but instead lumps it into broad categories for most species. For example, Dover sole and petrale sole, which are each reported in California landings, are lumped in the export category “flatfish”. This makes it hard to characterize demand for groundfish by end market preferences—we don’t know how much Dover stays in California or in the U.S., and how much is exported.

Another comparison conundrum is that the exports from California ports appear to include fish landed outside California waters. We did not include exports of pollock, haddock and cod since these are not recorded in the California landings data for the time period we compared. After filtering these out, there are relatively small volumes of groundfish (8-19%) exported as compared to landings in Figure 1.

Are there more money-makers like sablefish?

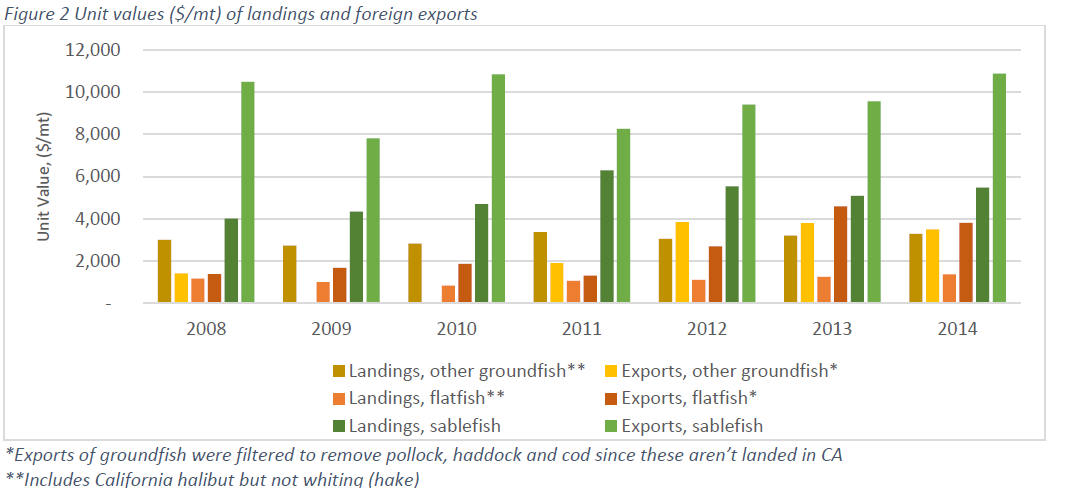
One bright point, in terms of value to the groundfish fishery, is sablefish. Sablefish seems to be driving not only value but volumes of exports from California. The average unit value (simply the landings value divided by the volume) for sablefish landings in California were usually twice as much as other groundfish from 2008 to 2014.For the same time period, the ratio of sablefish landed to sablefish exported averaged 24%, compared to 1 to 10% for most groundfish. Of course, this isn’t a wholly accurate comparison: since the sablefish exported from California may not have been landed there.

More than 90% of all exported sablefish over the time period assessed go to Japan, most of the sablefish going to Japan is frozen. Sablefish is doubly interesting because of this—not only are high value exports a rarity in this fishery, but so are high value frozen products.

Remaining questions include: Are there other species that can capitalize on the export market to Japan? Are there other species or markets that would have similar characteristics—a high value fish, exported in frozen form—where this success could be replicated?

Why does it seem that extremely low value groundfish is being exported?

Fig2

Another interesting comparison is the unit values of landings and exports in California, based on the same data provided by NMFS. We expect that export unit values would be higher than landing unit values, since they are likely processed and value-added. But for groundfish other than flatfish and sablefish, this expectation isn’t met. From 2008 through 2011, groundfish other than flatfish and sablefish had a higher unit value for landings than for exports.

There are a number of potential causes for this disparity:

  • We’re comparing different species. The “other groundfish” category that’s being exported is comprised of different species than the ones in the landings data. Perhaps these are low value species landed outside California and brought to California and exported.
  • Groundfish exports are lumped into a category other than “groundfish” for these years. Perhaps they’ve been exported in a product form that does not identify the type of fish.
  • Low value groundfish can’t be sold domestically. The groundfish being exported doesn’t match the domestic market demands and so the only market is a very low paying international market. Figure 3 compares the top five destinations for California groundfish.(Note that the Netherlands (NLD) appears to accept many low value imports in 2014.) Other than Japan, potential high value markets to explore include Vietnam and Canada. However, both these countries imported small amounts, albeit at high value, in 2014.

Fig3

[1] NMFS, “Commercial Landings,” page, Commercial Fishery Statistics, (2015), http://www.st.nmfs.noaa.gov/commercial-fisheries/commercial-landings/index
[2] NMFS, “Trade by Country,” page, Commercial Fishery Statistics, accessed February 18, 2015, http://www.st.nmfs.noaa.gov/commercial-fisheries/foreign-trade/applications/trade-by-country

Markets for Groundfish in California, Part 1 of 4

This is part 1 of a 4-part series intended to invite conversations in advance of our planned end market demand analysis for groundfish in California. The larger goal is to provide quantified end market data to inform profitable value chain investments that will positively impact harvesters, local communities and the ocean. Read more